National Grid 2009 Annual Report Download - page 22
Download and view the complete annual report
Please find page 22 of the 2009 National Grid annual report below. You can navigate through the pages in the report by either clicking on the pages listed below, or by using the keyword search tool below to find specific information within the annual report.-
 1
1 -
2
-
3
-
4
-
5
-
6
-
7
-
8
-
9
-
10
-
11
-
 12
12 -
 13
13 -
 14
14 -
 15
15 -
 16
16 -
 17
17 -
 18
18 -
 19
19 -
 20
20 -
 21
21 -
 22
22 -
 23
23 -
 24
24 -
 25
25 -
 26
26 -
 27
27 -
 28
28 -
 29
29 -
 30
30 -
 31
31 -
 32
32
 |
 |
20 National Grid plc Annual Review 2008/09
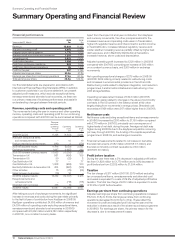
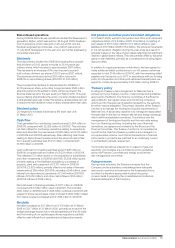
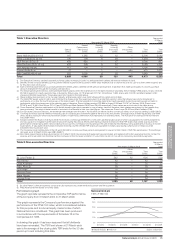
Summary Operating and Financial Review
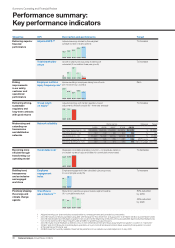
Objective KPI Description and performance Target
Adjusted EPS ‡ †
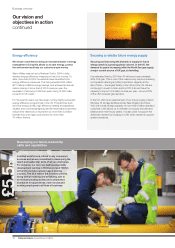
Delivering superior
financial
performance
Total shareholder
return
To increase
To increase
Employee lost time
injury frequency rate *
Driving
improvements
in our safety,
customer and
operational
performance
Zero
Group return
on equity^
Delivering strong,
sustainable
regulatory and
long-term contracts
with good returns
To increase
Controllable cost ~ Becoming more
efficient through
transforming our
operating model
To decrease
Network reliabilityModernising and
extending our
transmission
and distribution
networks
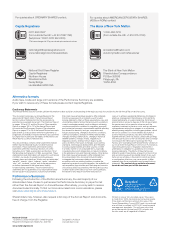
Performance Measure Target
04/05 05/06 06/07 07/08 08/09
Electricity transmission – UK 99.99998 99.9999 99.9999 99.9999 99.9999 % 99.9999
Gas transmission – UK 100 100 100 100 100 % 100
Gas distribution – UK 99.999 99.999 99.999 99.999 99.9999 % 99.999
Electricity transmission – US 385 348 259 437 266 MWh losses <303
Electricity distribution – US 120 141 121 110 114 Mins of outage <110 -120
Employee
engagement
index
Building trust,
transparency
and an inclusive
and engaged
workforce
To increase
Greenhouse
gas emissions # *
Positively shaping
the energy and
climate change
agenda
80% reduction
by 2050
45% reduction
by 2020
‡ Adjusted earnings per share excludes exceptional items, remeasurements and stranded cost recoveries
† 2007/08 includes continuing operations acquired with KeySpan for the period from 24 August 2007 to 31 March 2008 or as at 31 March 2008
* 2007/08 data restated as if KeySpan acquisition had occurred at the beginning of the year, previously published figure excluding KeySpan was
0.24 for employee lost time injury frequency rate and 38% for greenhouse gas emissions
^ 2007/08 results include KeySpan operations on a pro forma financial performance basis assuming the acquisition occurred on 1 April 2007
~ 2006/07 and 2007/08 results include KeySpan operations on a pro forma financial performance basis assuming the acquisition occurred
at the beginning of the fiscal year
# 2008/09 result not currently available. Result will be published on our website www.nationalgrid.com in July 2009
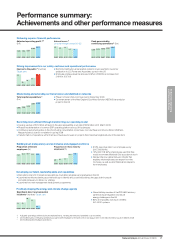
Performance summary:
Key performance indicators
Adjusted earnings divided by the weighted
average number of shares (pence)
Growth in share price assuming dividends are
reinvested (% cumulative three year growth)
Injuries resulting in employees taking time off work
(per 100,000 hours worked)
Adjusted earnings with certain regulatory based
adjustments divided by equity (% – three year average)
Regulated controllable operating costs (£m – comparatives stated on
a constant currency basis and inflated to current performance year)
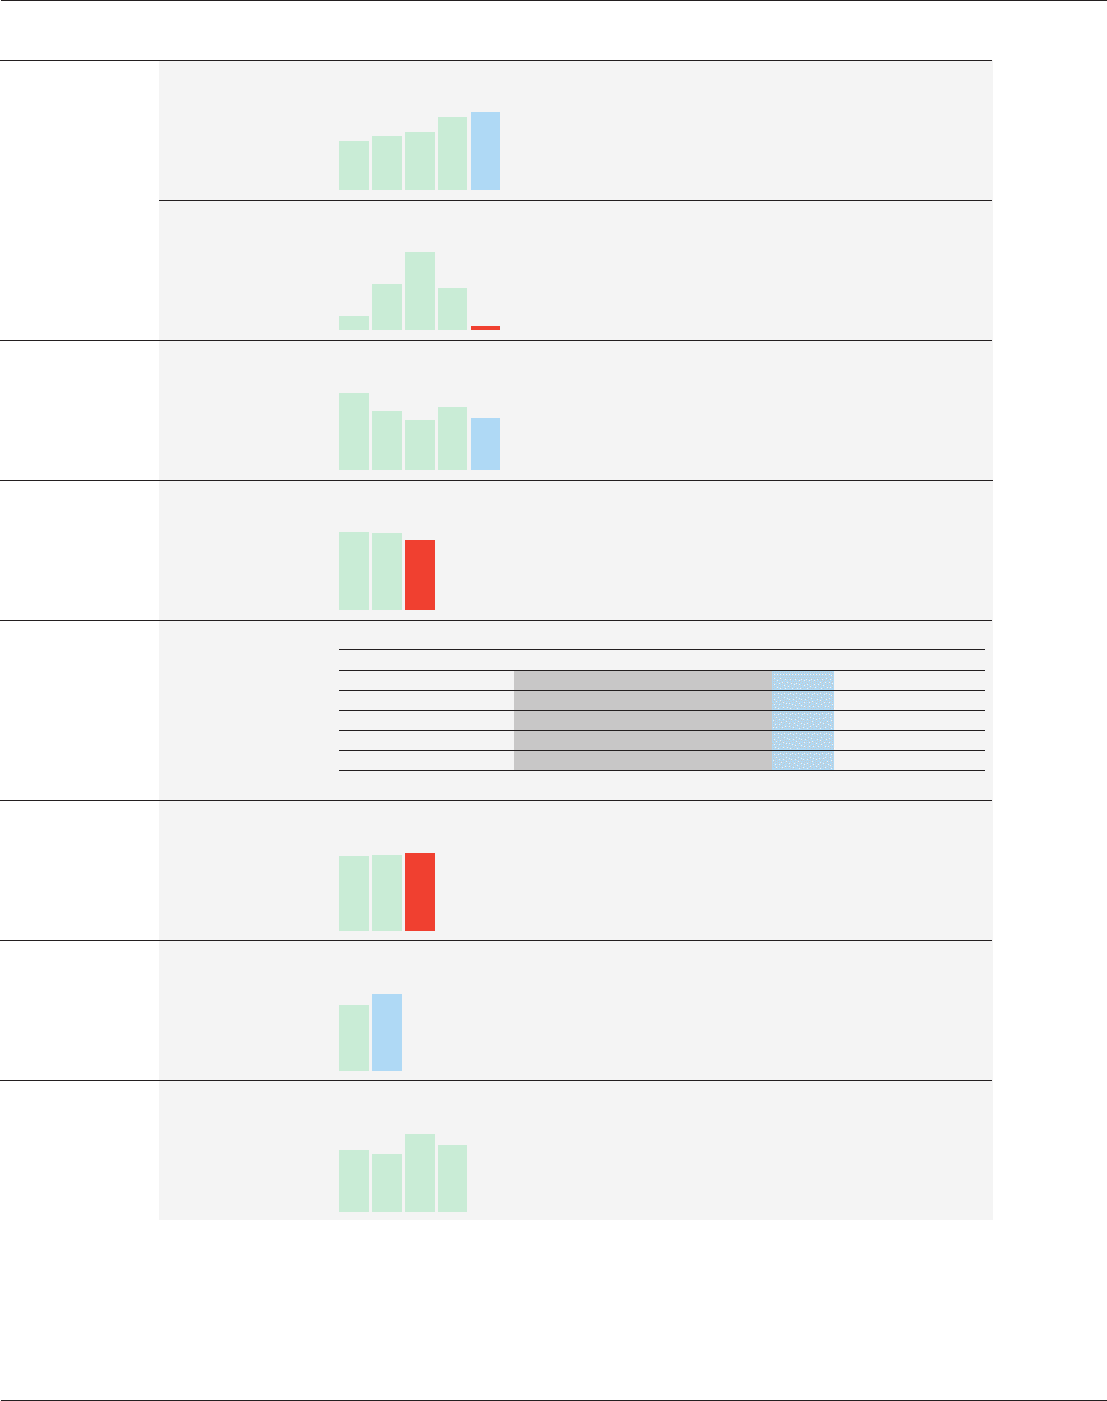
Employee engagement index calculated using responses
to our employee survey (%)
Reduction in greenhouse gas emissions against baseline
(% – cumulative reduction)
35.2
32.3 38.3
47.8
08/0907/0806/0705/0604/05
50.9
66
20
112
61
07/0806/0705/0604/05 08/09
6
2,332
2,307 2,387
08/0907/0806/07
0.28
0.37
0.24
0.30
07/0806/0705/0604/05
0.25
08/09
70
60
08/0907/08
26
28
35
30
07/0806/0705/0604/05
11.8
12.0 10.8
08/0907/0806/07