Morgan Stanley 2003 Annual Report Download - page 6
Download and view the complete annual report
Please find page 6 of the 2003 Morgan Stanley annual report below. You can navigate through the pages in the report by either clicking on the pages listed below, or by using the keyword search tool below to find specific information within the annual report.-
 1
1 -
 2
2 -
 3
3 -
 4
4 -
 5
5 -
 6
6 -
 7
7 -
 8
8 -
 9
9 -
 10
10 -
 11
11 -
 12
12 -
 13
13 -
 14
14 -
 15
15 -
 16
16 -
 17
17 -
18
-
19
-
20
-
21
-
22
-
23
-
24
-
25
-
26
-
27
-
28
-
29
-
30
-
31
-
32
-
33
-
34
-
35
-
36
-
37
-
38
 |
 |

2
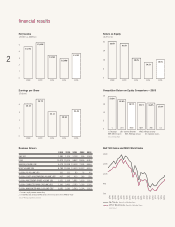
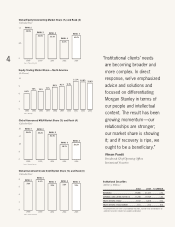
NetIncome
(DollarsinMillions)
6
5
4
3
2
1
0
$3,787
$2,988
$3,521
$5,456
$4,791
20032002200120001999
financialresults
ReturnonEquity
(InPercent)
32
24
16
8
0
16.5%
14.1%
18.0%
30.9%
32.6%
20032002200120001999
EarningsperShare
(Diluted)
5
4
3
2
1
0
$3.45
$2.69
$3.11
$4.73
$4.10
20032002200120001999
BusinessDrivers
1999 2000 2001 2002 2003
S&P500 1,389 1,315 1,139 936 1,058
DOW 10,878 10,415 9,852 8,896 9,782
NASDAQVOLUME($B) 9,478 19,928 11,609 7,524 6,866
NYSEVOLUME($B) 8,788 10,945 10,623 10,412 9,510
GLOBALIPOVOLUME($B) 161 221 83 76 45
GLOBALEQUITYUNDERWRITINGVOLUME($B)1 497 645 410 360 356
GLOBALINVESTMENTGRADEVOLUME($B) 1,635 1,638 1,885 1,639 1,924
GLOBALCOMPLETEDM&A$VOLUME($B)2 2,250 3,403 2,280 1,218 1,030
GLOBALANNOUNCEDM&A$VOLUME($B)2 3,082 3,240 1,593 1,074 1,183
1 Includesequity-relatedunderwriting
2 CompletedandannouncedM&Adataisfortransactionsof$100MMormore
Sources:FIBV,FactsetandThomsonFinancial
S&P500IndexandMSCIWorldIndex
1,500
1,300
1,100
900
700
3/99
6/99
9/99
12/99
3/00
6/00
9/00
12/00
3/01
6/01
9/01
12/01
3/02
6/02
9/02
12/02
3/03
6/03
9/03
12/03
Source:Factset
S&PIndex(LastFiveCalendarYears)
MSCIWorldIndex(LastFiveCalendarYears)
CompetitiveReturnonEquityComparison—2003
20
15
10
5
0
19.8%
C
18.2%
LEH
16.5%
MWD
16.1%
MER
16.0%
JPM
15.0%
GS
C:Citigroup LEH:LehmanBrothers MWD:MorganStanley
MER:MerrillLynch JPM:JPMorganChase GS:GoldmanSachs
Source:CompanyFilings