Morgan Stanley 2003 Annual Report Download - page 10
Download and view the complete annual report
Please find page 10 of the 2003 Morgan Stanley annual report below. You can navigate through the pages in the report by either clicking on the pages listed below, or by using the keyword search tool below to find specific information within the annual report.-
 1
1 -
 2
2 -
 3
3 -
 4
4 -
 5
5 -
 6
6 -
 7
7 -
 8
8 -
 9
9 -
 10
10 -
 11
11 -
 12
12 -
 13
13 -
 14
14 -
 15
15 -
 16
16 -
 17
17 -
 18
18 -
 19
19 -
 20
20 -
 21
21 -
22
-
23
-
24
-
25
-
26
-
27
-
28
-
29
-
30
-
31
-
32
-
33
-
34
-
35
-
36
-
37
-
38
 |
 |

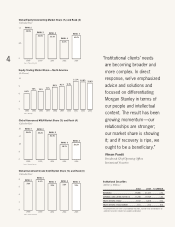
4“Institutionalclients’needs
arebecomingbroaderand
morecomplex.Indirect
response,we’veemphasized
adviceandsolutionsand
focusedondifferentiating
MorganStanleyintermsof
ourpeopleandintellectual
content.Theresulthasbeen
growingmomentum—our
relationshipsarestronger;
ourmarketshareisshowing
it;andifrecoveryisripe,we
oughttobeabeneficiary.”
VikramPandit
President&ChiefOperatingOfcer,
InstitutionalSecurities
EquityTradingMarketShare—NorthAmerica
(InPercent)
12
9
6
3
0
6.4%
1994
7.4%
1995
7.2%
1996
7.7%
1997
8.8%
1998
9.1%
1999
9.3%
2000
11.1%
2001
10.8%
2002
10.4%
2003
Source:McLagan
GlobalInvestmentGradeDebtMarketShare(%)andRank(#)
(CalendarYear)
8
6
4
2
0
RANK:4
RANK:4
RANK:4
RANK:4
RANK:4
7.0%
7.2%
7.0%
8.1%
7.5%
20032002200120001999
Source:ThomsonFinancial
GlobalAnnouncedM&AMarketShare(%)andRank(#)
(CalendarYear)
36
27
18
9
0
RANK:2
RANK:3
RANK:2
RANK:2
RANK:3
20.2%
18.1%
30.3%
34.2%
34.6%
20032002200120001999
Source:ThomsonFinancial
InstitutionalSecurities
(DollarsinMillions)
2002 2003 %CHANGE
REVENUES 19,885 23,157 16%
EXPENSES(INCLUDINGINTEREST) 17,248 19,549 13%
PROFITBEFORETAXES* 2,637 3,608 37%
PROFITBEFORETAXESMARGIN 13% 16% N/A
*Incomebeforelossesfromunconsolidatedinvestees,incometaxesanddividendson
preferredsecuritiessubjecttomandatoryredemption
GlobalEquityUnderwritingMarketShare(%)andRank(#)
(CalendarYear)
13
6.5
0
RANK:3
RANK:4
RANK:4
RANK:3
RANK:2
10.0%
8.0%
10.3%
10.6%
12.6%
20032002200120001999
Source:ThomsonFinancial