Morgan Stanley 2003 Annual Report Download - page 14
Download and view the complete annual report
Please find page 14 of the 2003 Morgan Stanley annual report below. You can navigate through the pages in the report by either clicking on the pages listed below, or by using the keyword search tool below to find specific information within the annual report.
6“Oursatisfactionsurveys
showourclientsplace
ahighvalueontrusting
relationshipswiththeir
financialadvisors.Thisyear,
wefocusedonorganizing
ourbusinessaroundspecific
clientsegments,which
hasallowedustobetter
tailorsolutionstotheir
needs.Buildingontrusting
relationships,tailoring
solutionsandkeeping
costsdownresultedina
dramaticallyimprovedprofit
pictureasmarketsimproved
andindividualinvestors
returnedinstrength.”
JohnSchaefer
President&ChiefOperatingOfcer,
IndividualInvestorGroup
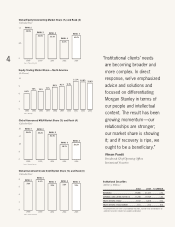
ClientAssets
(DollarsinBillions)
660
440
220
0
$565
$516
$595
$654
$595
$445
200320022001200019991998
Headcount
(FinancialAdvisorsandNon-salesStaff)
12,546
8,694
2002
11,086
7,840
21,240
18,926
2003
Non-sales
FinancialAdvisors
(excludestrainees)
Fee-BasedAssets%ofTotalAssets
25
20
15
10
5
0
23%
21%
19%
18%
14%
12%
200320022001200019991998
IndividualInvestorGroup
(DollarsinMillions)
2002 2003 %CHANGE
REVENUES 4,264 4,167 –2%
EXPENSES(INCLUDINGINTEREST) 4,155 3,713 –11%
PROFITBEFORETAXES 109 454 317%
PROFITBEFORETAXESMARGIN 3% 11% N/A
SatisfactionLevelofU.S.High
NetWorthClientsoftheFirm
(PercentExceptionallyorVerySatised)
58
54
50
46
42
54%
2002
58%
2003
Source:MorganStanleyRetail
NationalClientSatisfactionSurvey
Source:CompanyFilings
Source:CompanyFilings


