Microsoft 2013 Annual Report Download - page 21
Download and view the complete annual report
Please find page 21 of the 2013 Microsoft annual report below. You can navigate through the pages in the report by either clicking on the pages listed below, or by using the keyword search tool below to find specific information within the annual report.-
 1
1 -
2
-
3
-
4
-
5
-
6
-
7
-
8
-
9
-
10
-
 11
11 -
 12
12 -
 13
13 -
 14
14 -
 15
15 -
 16
16 -
 17
17 -
 18
18 -
 19
19 -
 20
20 -
 21
21 -
 22
22 -
 23
23 -
 24
24 -
 25
25 -
 26
26 -
 27
27 -
 28
28 -
 29
29 -
 30
30 -
 31
31 -
32
-
33
-
34
-
35
-
36
-
37
-
38
-
39
-
40
-
41
-
42
-
43
-
44
-
45
-
46
-
47
-
48
-
49
-
50
-
51
-
52
-
53
-
54
-
55
-
56
-
57
-
58
-
59
-
60
-
61
-
62
-
63
-
64
-
65
-
66
-
67
-
68
-
69
-
70
-
71
-
72
-
73
-
74
-
75
-
76
-
77
-
78
-
79
-
80
-
81
-
82
-
83
-
84
-
85
-
86
-
87
 |
 |

Fiscal year 2012 diluted earnings per share were negatively impacted by the non-tax deductible goodwill impairment
charge, which decreased diluted earnings per share by $0.73. Fiscal year 2011 net income and diluted earnings per share
reflected a partial settlement with the U.S. Internal Revenue Service (“I.R.S.”) and higher other income. The partial
settlement with the I.R.S. added $461 million to net income and $0.05 to diluted earnings per share in fiscal year 2011.
SEGMENT REVENUE/OPERATING INCOME (LOSS)
The revenue and operating income (loss) amounts in this section are presented on a basis consistent with accounting
principles generally accepted in the U.S. (“U.S. GAAP”) and include certain reconciling items attributable to each of the
segments. Segment information appearing in Note 21 – Segment Information and Geographic Data of the Notes to
Financial Statements is presented on a basis consistent with our internal management reporting. Certain corporate-level
activity has been excluded from segment operating results and is analyzed separately. We have recast certain prior
period amounts within this MD&A to conform to the way we internally managed and monitored segment performance
during fiscal year 2013, reflecting immaterial movements of business activities between segments and changes in cost
allocations. In July 2013, we announced a change in organizational structure as part of our transformation to a devices
and services company. As we evolve how we allocate resources and analyze performance in the new structure, it is
possible that our segments may change.
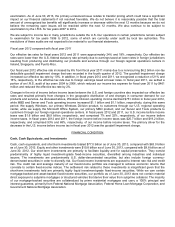
Windows Division
(In millions, except percentages)
2013
2012
2011
Percentage
Change 2013
Versus 2012
Percentage
Change
2012
Versus 2011
Revenue
$ 19,239
$ 18,400
$ 19,061
5%
(3)%
Operating income
$ 9,504
$ 11,555
$ 12,280
(18)%
(6)%
Windows Division develops and markets operating systems for computing devices, related software and online services,
Surface RT and Pro devices, and PC accessories. This collection of software, hardware, and services is designed to
empower individuals, companies, and organizations and to simplify everyday tasks through seamless operations across
the user’s hardware and software. The general availability of Surface RT and Windows 8 started October 26, 2012. The
general availability of Surface Pro started February 9, 2013.
Currently, approximately 65% of total Windows Division revenue comes from Windows operating systems purchased by
original equipment manufacturers (“OEMs”) and pre-installed on devices they sell. The remaining Windows Division
revenue is generated by commercial and retail sales of Windows, Surface, PC accessories, and online advertising.
Fiscal year 2013 compared with fiscal year 2012
Windows Division revenue increased $839 million. Surface revenue was $853 million. Revenue from commercial licensing
of Windows increased $487 million, while unearned revenue from commercial licensing also increased, reflecting
continued support of our platform. In addition, we recognized $540 million of previously deferred revenue related to the
expiration of the Windows Upgrade Offer. Partially offsetting these increases was a decrease in OEM revenue.
OEM revenue decreased 3%. Excluding the impact of the Windows Upgrade Offer, OEM revenue decreased 10%. This
decrease primarily reflects the impact on revenue of the decline in the x86 PC market, which we estimate declined
approximately 9%.
In May 2013, we announced that we had surpassed 100 million licenses sold for Windows 8.
Windows Division operating income decreased, primarily due to higher cost of revenue and sales and marketing
expenses, offset in part by revenue growth. Cost of revenue increased $1.8 billion, reflecting a $1.6 billion increase in