Mercedes 2003 Annual Report Download - page 3
Download and view the complete annual report
Please find page 3 of the 2003 Mercedes annual report below. You can navigate through the pages in the report by either clicking on the pages listed below, or by using the keyword search tool below to find specific information within the annual report.-
 1
1 -
 2
2 -
 3
3 -
 4
4 -
 5
5 -
 6
6 -
 7
7 -
 8
8 -
 9
9 -
 10
10 -
 11
11 -
 12
12 -
 13
13 -
 14
14 -
15
-
16
-
17
-
18
-
19
-
20
-
21
-
22
-
23
-
24
-
25
-
26
-
27
-
28
-
29
-
30
-
31
-
32
-
33
-
34
-
35
-
36
-
37
-
38
-
39
-
40
-
41
-
42
-
43
-
44
-
45
-
46
-
47
-
48
-
49
-
50
-
51
-
52
-
53
-
54
-
55
-
56
-
57
-
58
-
59
-
60
-
61
-
62
-
63
-
64
-
65
-
66
-
67
-
68
-
69
-
70
-
71
-
72
-
73
-
74
-
75
-
76
-
77
-
78
-
79
-
80
-
81
-
82
-
83
-
84
-
85
-
86
-
87
-
88
-
89
-
90
-
91
-
92
-
93
-
94
-
95
-
96
-
97
-
98
-
99
-
100
-
101
-
102
-
103
-
104
-
105
-
106
-
107
-
108
-
109
-
110
-
111
-
112
-
113
-
114
-
115
-
116
-
117
-
118
-
119
-
120
-
121
-
122
-
123
-
124
-
125
-
126
-
127
-
128
-
129
-
130
-
131
-
132
-
133
-
134
-
135
-
136
-
137
-
138
-
139
-
140
-
141
-
142
-
143
-
144
-
145
-
146
-
147
-
148
-
149
-
150
-
151
-
152
-
153
-
154
-
155
-
156
-
157
-
158
-
159
-
160
-
161
-
162
-
163
-
164
-
165
-
166
-
167
-
168
-
169
-
170
-
171
-
172
-
173
-
174
-
175
-
176
-
177
-
178
-
179
-
180
-
181
-
182
-
183
-
184
 |
 |

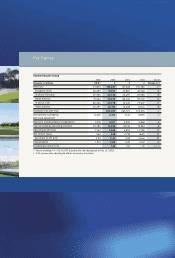
Divisions
9%
25%
37%
12%
7%
Percentage of Sales
S-Class/SL/Maybach
E-Class
C-Class/CLK/
SLK/Sport Coupe
A-Class
M-Class/G-Class
smart
22%
25%
18%
35%
Passenger Cars
48%
42%
6%
Vans (incl. V-Class)
Trucks/Unimogs
Buses
Light Trucks
Minivans
SUVs
Percentage of Sales
Percentage of Sales
Amounts in millions
Mercedes Car Group
20032003 2002
US $€€
Amounts in millions
Chrysler Group
20032003 2002
US $€€
Amounts in millions
Commercial Vehicles
20032003 2002
US $€€
Amounts in millions
Services
20032003 2002
US $€€
Amounts in millions
Other Activities
20032003 2002
US $€€
03/02
Change in %
03/02
Change in %
03/02
Change in %
03/02
Change in %
03/02
Change in %
3,938
64,807
3,702
3,385
3,126
51, 4 4 6
2,939
2,687
1,216,938
104,151
3,020
50,170
2,495
2,794
1,232,334
101,778
+4
+3
+18
-4
-1
+2
Operating profit
Revenues
Investments in property,
plant and equipment
Research and
development expenditure
Unit sales
Employees (Dec. 31)
(637)
62,130
3,133
2,128
(506)
49,321
2,487
1,689
2,637,867
93,062
609
60,181
3,155
2,062
2,822,659
95,835
.
-18
-21
-18
-7
-3
Operating profit (Loss)
Revenues
Investments in property,
plant and equipment
Research and
development expenditure
Unit sales
Employees (Dec. 31)
1,077
35,923
1,267
1,276
855
28,517
1,006
1,013
500,981
95,062
(343)
28,401
1,263
959
485,408
9 4 ,111
.
+0
-20
+6
+3
+1
Operating profit (Loss)
Revenues
Investments in property,
plant and equipment
Research and
development expenditure
Unit sales
Employees (Dec. 31)
-59
-11
-20
+5
3,060
15,699
95
10,521
1,240
14,037
76
11,035
1,562
17,682
96
Operating profit
Revenues
Investments in property,
plant and equipment
Employees (Dec. 31)
1,619
554
152
229
1,285
440
121
182
13,144
903
508
137
127
21,184
+42
-13
-12
+43
-38
Operating profit
Revenues
Investments in property,
plant and equipment
Research and
development expenditure
Employees (Dec. 31)
10%