ManpowerGroup 2008 Annual Report Download - page 16
Download and view the complete annual report
Please find page 16 of the 2008 ManpowerGroup annual report below. You can navigate through the pages in the report by either clicking on the pages listed below, or by using the keyword search tool below to find specific information within the annual report.-
 1
1 -
2
-
3
-
4
-
5
-
 6
6 -
 7
7 -
 8
8 -
 9
9 -
 10
10 -
 11
11 -
 12
12 -
 13
13 -
 14
14 -
 15
15 -
 16
16 -
 17
17 -
 18
18 -
 19
19 -
 20
20 -
 21
21 -
 22
22 -
 23
23 -
 24
24 -
 25
25 -
 26
26 -
27
-
28
-
29
-
30
-
31
-
32
-
33
-
34
-
35
-
36
-
37
-
38
-
39
-
40
-
41
-
42
-
43
-
44
-
45
-
46
-
47
-
48
-
49
-
50
-
51
-
52
-
53
-
54
-
55
-
56
-
57
-
58
-
59
-
60
-
61
-
62
-
63
-
64
-
65
-
66
-
67
-
68
-
69
-
70
-
71
-
72
-
73
-
74
-
75
-
76
-
77
-
78
 |
 |

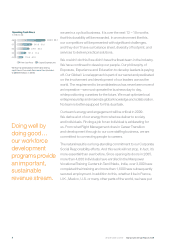
14 Manpower at a Glance Manpower Annual Report 2008
United States 1,945.4
France 6,935.6
Other EMEA 7,437.7
Italy 1,519.5
Jefferson Wells 291.0
Right Management 449.7
Other Operations 2,973.9
United States 32.2
France 299.0
Other EMEA 249.5
Italy 120.3
Jefferson Wells (19.6)
Right Management 44.6
Other Operations 54.5
Stock Exchange
NYSE (Ticker: MAN)
Fiscal Year End Date
December 31
Market Capitalization
$2.7 billion (as of Dec 31, 2008)
Number of Shares Issued
103,756,138
(as of Dec 31, 2008)
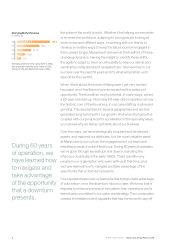
In 2008 Manpower revenues increased to
a record $21.6 billion despite a difficult
operating environment.
For 15 years, Manpower has achieved 14% CAGR (13% before acquisitions). * Temporary and contract only
93
24
06
18
12
94 95 96 97 98 99 00 01 02 03 04 05 06 07 08
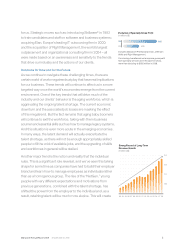
2008 Segment Revenues
in millions ($)
2008 Segment Operating
Unit Profit
in millions ($)
Strong Record of Long-Term Revenue Growth
in billions ($)
Systemwide Offices People Placed in Permanent,
Temporary and Contract
Positions
Stock Information
07
4.6 Million
08
4.0 Million
06
4.4 Million
05
4.0 Million
2.0 Million*
04
Offices across 82 countries and
territories allow us to meet the
needs of clients in all industry
segments. Systemwide Offices
represents our branch offices
plus the offices operating under a
franchise agreement with us.
4,407
08
06
4,365
07
4,498
05
4,429
4,338
04
Shares Outstanding
77,964,197 (as of Dec 31, 2008)
Avg. Daily Volume
1,000,000 + shares per day in 2008
2008 Share Price High and Low
$70.35/ $23.60