Macy's 2003 Annual Report Download - page 3
Download and view the complete annual report
Please find page 3 of the 2003 Macy's annual report below. You can navigate through the pages in the report by either clicking on the pages listed below, or by using the keyword search tool below to find specific information within the annual report.-
 1
1 -
 2
2 -
 3
3 -
 4
4 -
 5
5 -
 6
6 -
 7
7 -
 8
8 -
 9
9 -
 10
10 -
 11
11 -
 12
12 -
 13
13 -
 14
14
 |
 |

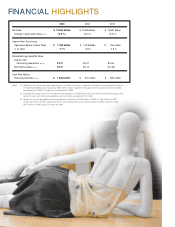
2003 2002 2001
Net Sales $ 15.264 billion $ 15.435 billion $ 15.651 billion
Change in same-store sales (Note 1) (0.9 %) (3.0 % ) (5.3 % )
Income From Continuing
Operations Before Income Taxes $ 1.084 billion $ 1.048 billion $ 764
million
% of sales 7.1 % 6.8 % 4.9 %
Diluted Earnings (Loss) Per Share
Income from
Continuing Operations (Not e 2) $3.71 $3.21 $2.54
Net Income (Loss) (Not e 2) $3.71 $4.12 $(1.38)
Cash Flow Before
Financing Activities (Note 3) $ 1.028 billion $ 531
million
$ 580
million
Notes: (1) Represents the year-to-year percentage change in net sales from stores in operation throughout the year presented and the
immediately preceding year, including for 2001 Stern’s stores in operation throughout the first quarter of 2001 and 2000,
and excluding for 2001 the impact of the 53rd week in 2000.
(2) Excluding the impact of a one-time $.20 per share reduction in net deferred income tax liabilities, diluted earnings per share
for both income from continuing operations and net income would be $3.51 in 2003.
(3) Represents net cash provided by continuing operating activities of $1,590 million for 2003, $1,168 million for 2002,
and $1,351 million for 2001 reduced by the net cash used by continuing investing activities of $562 million for 2003,
$637 million for 2002 and $771 million for 2001.
FINANCIAL HIGHLIGHTS