Macy's 2002 Annual Report Download - page 3
Download and view the complete annual report
Please find page 3 of the 2002 Macy's annual report below. You can navigate through the pages in the report by either clicking on the pages listed below, or by using the keyword search tool below to find specific information within the annual report.-
 1
1 -
 2
2 -
 3
3 -
 4
4 -
 5
5 -
 6
6 -
 7
7 -
 8
8 -
 9
9 -
 10
10 -
 11
11 -
 12
12 -
 13
13 -
 14
14
 |
 |

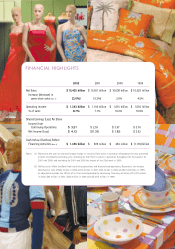
2002 2001 2000 1999
Net Sales $ 15.435 billion $ 15.651 billion $ 16.638 billion $ 16.029 billion
Increase (decrease) in
same-store sales (Note 1) (3.0%) (5.3%) 2.0% 4.5%
Operating Income $ 1.343 billion $ 1.104 billion $ 1.691 billion $ 1.693 billion
% of sales 8.7% 7.1% 10.2% 10.6%
Diluted Earnings (Loss) Per Share
Income from
Continuing Operations $3.21 $ 2.59 $ 3.97 $ 3.76
Net Income (Loss) $4.12 $ (1.38) $ (.89) $ 3.62
Cash Inflow (Outflow) Before
Financing Activities (Note 2) $ 1.455 billion $ 509 million $ 254 million $ (1.135) billion
Notes: (1) Represents the year-to-year percentage change in net sales from stores in operation throughout the year presented
and the immediately preceding year, including for 2001 Stern’s stores in operation throughout the first quarter of
2001 and 2000, and excluding for 2001 and 2000 the impact of the 53rd week in 2000.
(2) Reflects cash inflow (outflow) from continuing operations and discontinued operations. Represents net increase
(decrease) in cash of $80 million in 2002, $414 million in 2001, $49 million in 2000 and $(134) million in 1999,
as adjusted to exclude the effects of net cash used (provided) by continuing financing activities of $1,375 million
in 2002, $95 million in 2001, $205 million in 2000 and $(1,001) million in 1999.
FINANCIAL HIGHLIGHTS