Macy's 2001 Annual Report Download - page 3
Download and view the complete annual report
Please find page 3 of the 2001 Macy's annual report below. You can navigate through the pages in the report by either clicking on the pages listed below, or by using the keyword search tool below to find specific information within the annual report.-
 1
1 -
 2
2 -
 3
3 -
 4
4 -
 5
5 -
 6
6 -
 7
7 -
 8
8 -
 9
9 -
 10
10 -
 11
11 -
 12
12 -
 13
13 -
 14
14
 |
 |

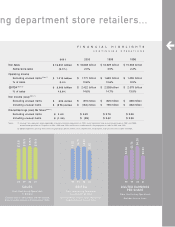
2001 2000 1999 1998
Net Sales $ 15.651 billion $ 16.638 billion $ 16.029 billion $ 15.365 billion
Same- st ore sales (5.3% ) 2.0% 4.5% 2.2%
Operat ing Income
Excluding unusual it ems (Not e 1) $ 1.319 billion $ 1.771 billion $ 1.693 billion $ 1.455 billion
% of sales 8.4% 10.6% 10.6% 9.5%
EBITDA (Note 2) $ 2.008 billion $ 2.422 billion $ 2.358 billion $ 2.079 billion
% of sales 12.8% 14.6% 14.7% 13.5%
Net Income (Loss) (Not e 1)
Excluding unusual it ems $ 604 million $870million $ 825 million $ 685 million
Including unusual it ems $ (276) million $ (184) million $ 795 million $ 662 million
Dilut ed Earnings (Loss) Per Share (Not e 1)
Excluding unusual it ems $ 3.03 $ 4.20 $ 3.76 $ 3.06
Including unusual it ems $ (1.38) $ (.89) $ 3.62 $ 2.96
Not es: (1) Unusual items represent , w here applicable, invent ory valuat ion adjustment s in 2001, asset impairment and rest ructuring charges in 2001 and 2000,
discont inued operat ions of Fingerhut in 2001, 2000 and 1999, and t he loss associat ed w ith t he prepayment of debt in 2001 and 1998.
(2) EBITDA represent s earnings from cont inuing operat ions before int erest , taxes, depreciat ion, amort izat ion, and unusual items in 2001 and 2000.
$14.8
$15.5
$15.9
$15.5
$3.06
$3.76
$4.20
$3.03
SALES
From Continuing Operat ions
In Billions
(Excludes sales of st ores closed and not replaced,
discont inued businesses and 53rd week of 2000)
DILUTED EARNINGS
PER SHARE
From Continuing Operat ions
(Excludes Unusual It ems)
EBITDA
From Continuing Operat ions
As a Percent of Sales
(Earnings Bef ore Int erest , Taxes, Depreciat ion,
Amort ization and Unusual It ems)
13.5%
14.7%
14.6%
12.8%
98 99 00 01 98 99 00 01 98 99 00 01
ng department store retailers...
FIN A N CIAL HIGHLIGHTS
CO N TIN UIN G O PERATIO N S