Kentucky Fried Chicken 2011 Annual Report Download - page 191
Download and view the complete annual report
Please find page 191 of the 2011 Kentucky Fried Chicken annual report below. You can navigate through the pages in the report by either clicking on the pages listed below, or by using the keyword search tool below to find specific information within the annual report.-
 1
1 -
2
-
3
-
4
-
5
-
6
-
7
-
8
-
9
-
10
-
11
-
12
-
13
-
14
-
15
-
16
-
17
-
18
-
19
-
20
-
21
-
22
-
23
-
24
-
25
-
26
-
27
-
28
-
29
-
30
-
31
-
32
-
33
-
34
-
35
-
36
-
37
-
38
-
39
-
40
-
41
-
42
-
43
-
44
-
45
-
46
-
47
-
48
-
49
-
50
-
51
-
52
-
53
-
54
-
55
-
56
-
57
-
58
-
59
-
60
-
61
-
62
-
63
-
64
-
65
-
66
-
67
-
68
-
69
-
70
-
71
-
72
-
73
-
74
-
75
-
76
-
77
-
78
-
79
-
80
-
81
-
82
-
83
-
84
-
85
-
86
-
87
-
88
-
89
-
90
-
91
-
92
-
93
-
94
-
95
-
96
-
97
-
98
-
99
-
100
-
101
-
102
-
103
-
104
-
105
-
106
-
107
-
108
-
109
-
110
-
111
-
112
-
113
-
114
-
115
-
116
-
117
-
118
-
119
-
120
-
121
-
122
-
123
-
124
-
125
-
126
-
127
-
128
-
129
-
130
-
131
-
132
-
133
-
134
-
135
-
136
-
137
-
138
-
139
-
140
-
141
-
142
-
143
-
144
-
145
-
146
-
147
-
148
-
149
-
150
-
151
-
152
-
153
-
154
-
155
-
156
-
157
-
158
-
159
-
160
-
161
-
162
-
163
-
164
-
165
-
166
-
167
-
168
-
169
-
170
-
171
-
172
-
173
-
174
-
175
-
176
-
177
-
178
-
179
-
180
-
 181
181 -
 182
182 -
 183
183 -
 184
184 -
 185
185 -
 186
186 -
 187
187 -
 188
188 -
 189
189 -
 190
190 -
 191
191 -
 192
192 -
 193
193 -
 194
194 -
 195
195 -
 196
196 -
 197
197 -
 198
198 -
 199
199 -
 200
200 -
 201
201 -
202
-
203
-
204
-
205
-
206
-
207
-
208
-
209
-
210
-
211
-
212
 |
 |

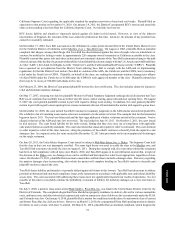
87
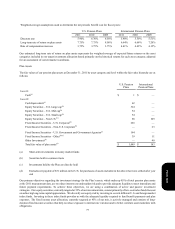
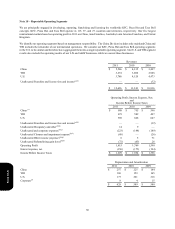
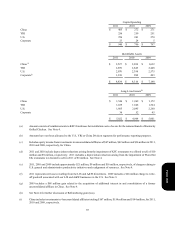
China
YRI
U.S.
Corporate
Capital Spending
2011
$ 405
256
256
23
$ 940
2010
$ 272
259
241
24
$ 796
2009
$ 271
251
270
5
$ 797
China (i)
YRI
U.S.
Corporate(j)
Identifiable Assets
2011
$ 2,527
2,899
2,070
1,338
$ 8,834
2010
$ 2,289
2,649
2,398
980
$ 8,316
2009
$ 1,632
2,448
2,575
493
$ 7,148
China
YRI
U.S.
Corporate
Long-Lived Assets(k)
2011
$ 1,546
1,635
1,805
36
$ 5,022
2010
$ 1,269
1,548
2,095
52
$ 4,964
2009
$ 1,172
1,524
2,260
45
$ 5,001
(a) Amount consists of reimbursements to KFC franchisees for installation costs of ovens for the national launch of Kentucky
Grilled Chicken. See Note 4.
(b) Amounts have not been allocated to the U.S., YRI or China Division segments for performance reporting purposes.
(c) Includes equity income from investments in unconsolidated affiliates of $47 million, $42 million and $36 million in 2011,
2010 and 2009, respectively, for China.
(d) 2011 and 2010 include depreciation reductions arising from the impairment of KFC restaurants we offered to sell of $10
million and $9 million, respectively. 2011 includes a depreciation reduction arising from the impairment of Pizza Hut
UK restaurants we decided to sell in 2011 of $3 million. See Note 4.
(e) 2011, 2010 and 2009 include approximately $21 million, $9 million and $16 million, respectively, of charges relating to
U.S. general and administrative productivity initiatives and realignment of resources. See Note 4.
(f) 2011 represents net losses resulting from the LJS and A&W divestitures. 2009 includes a $26 million charge to write-
off goodwill associated with our LJS and A&W businesses in the U.S. See Note 9.
(g) 2009 includes a $68 million gain related to the acquisition of additional interest in and consolidation of a former
unconsolidated affiliate in China. See Note 4.
(h) See Note 4 for further discussion of Refranchising gain (loss).
(i) China includes investments in 4 unconsolidated affiliates totaling $167 million, $154 million and $144 million, for 2011,
2010 and 2009, respectively.
Form 10-K