Kentucky Fried Chicken 2011 Annual Report Download - page 187
Download and view the complete annual report
Please find page 187 of the 2011 Kentucky Fried Chicken annual report below. You can navigate through the pages in the report by either clicking on the pages listed below, or by using the keyword search tool below to find specific information within the annual report.-
 1
1 -
2
-
3
-
4
-
5
-
6
-
7
-
8
-
9
-
10
-
11
-
12
-
13
-
14
-
15
-
16
-
17
-
18
-
19
-
20
-
21
-
22
-
23
-
24
-
25
-
26
-
27
-
28
-
29
-
30
-
31
-
32
-
33
-
34
-
35
-
36
-
37
-
38
-
39
-
40
-
41
-
42
-
43
-
44
-
45
-
46
-
47
-
48
-
49
-
50
-
51
-
52
-
53
-
54
-
55
-
56
-
57
-
58
-
59
-
60
-
61
-
62
-
63
-
64
-
65
-
66
-
67
-
68
-
69
-
70
-
71
-
72
-
73
-
74
-
75
-
76
-
77
-
78
-
79
-
80
-
81
-
82
-
83
-
84
-
85
-
86
-
87
-
88
-
89
-
90
-
91
-
92
-
93
-
94
-
95
-
96
-
97
-
98
-
99
-
100
-
101
-
102
-
103
-
104
-
105
-
106
-
107
-
108
-
109
-
110
-
111
-
112
-
113
-
114
-
115
-
116
-
117
-
118
-
119
-
120
-
121
-
122
-
123
-
124
-
125
-
126
-
127
-
128
-
129
-
130
-
131
-
132
-
133
-
134
-
135
-
136
-
137
-
138
-
139
-
140
-
141
-
142
-
143
-
144
-
145
-
146
-
147
-
148
-
149
-
150
-
151
-
152
-
153
-
154
-
155
-
156
-
157
-
158
-
159
-
160
-
161
-
162
-
163
-
164
-
165
-
166
-
167
-
168
-
169
-
170
-
171
-
172
-
173
-
174
-
175
-
176
-
 177
177 -
 178
178 -
 179
179 -
 180
180 -
 181
181 -
 182
182 -
 183
183 -
 184
184 -
 185
185 -
 186
186 -
 187
187 -
 188
188 -
 189
189 -
 190
190 -
 191
191 -
 192
192 -
 193
193 -
 194
194 -
 195
195 -
 196
196 -
 197
197 -
198
-
199
-
200
-
201
-
202
-
203
-
204
-
205
-
206
-
207
-
208
-
209
-
210
-
211
-
212
 |
 |

83
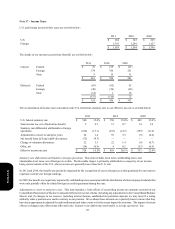
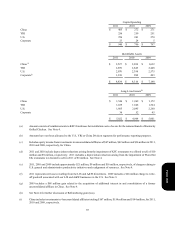
In 2009, this item included out-of-year adjustments which lowered our effective tax rate by 1.6 percentage points.
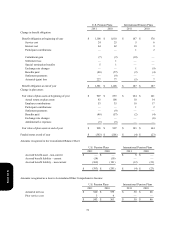
Change in valuation allowance. This item relates to changes for deferred tax assets generated or utilized during the current year
and changes in our judgment regarding the likelihood of using deferred tax assets that existed at the beginning of the year. The
impact of certain changes may offset items reflected in the ‘Statutory rate differential attributable to foreign operations’ line. The
Company considers all available positive and negative evidence, including the amount of taxable income and periods over which
it must be earned, actual levels of past taxable income and known trends and events or transactions expected to affect future levels
of taxable income.
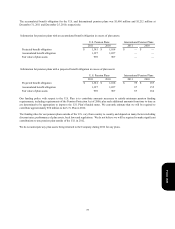
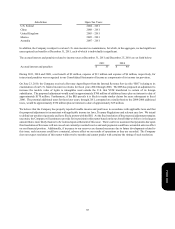
In 2011, $22 million of net tax expense was driven by $15 million for valuation allowances recorded against deferred tax assets
generated during the current year and $7 million of tax expense resulting from a change in judgment regarding the future use of
certain foreign deferred tax assets that existed at the beginning of the year. These amounts exclude $45 million in valuation
allowance additions related to capital losses recognized as a result of the LJS and A&W divestitures, which are presented within
Net Benefit from LJS and A&W divestitures.
In 2010, the $22 million of net tax expense was driven by $25 million for valuation allowances recorded against deferred tax assets
generated during the current year. This expense was partially offset by a $3 million tax benefit resulting from a change in judgment
regarding the future use of U.S. state deferred tax assets that existed at the beginning of the year.
In 2009, the $9 million net tax benefit was driven by $25 million of benefit resulting from a change in judgment regarding the
future use of foreign deferred tax assets that existed at the beginning of the year. This benefit was partially offset by $16 million
for valuation allowances recorded against deferred tax assets generated during the year.
Net benefit from LJS and A&W divestitures. This item includes a one-time $117 million tax benefit, including approximately $8
million state benefit, recognized on the LJS and A&W divestitures in 2011, partially offset by $45 million of valuation allowance,
including approximately $4 million state expense, related to capital loss carryforwards recognized as a result of the divestitures.
In addition, we recorded $32 million of tax benefits on $86 million of pre-tax losses and other costs, which resulted in $104 million
of total net tax benefits related to the divestitures.
Other. This item primarily includes the impact of permanent differences related to current year earnings and U.S. tax credits.
In 2009, this item was positively impacted by a one-time pre-tax gain of approximately $68 million, with no related income tax
expense, recognized on our acquisition of additional interest in, and consolidation of, the entity that operates KFC in Shanghai,
China. This was partially offset by a pre-tax U.S. goodwill impairment charge of approximately $26 million, with no related
income tax benefit.
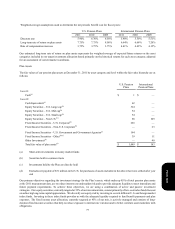
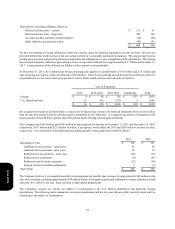
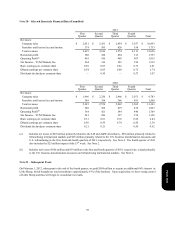
The details of 2011 and 2010 deferred tax assets (liabilities) are set forth below:
Operating losses and tax credit carryforwards
Employee benefits
Share-based compensation
Self-insured casualty claims
Lease-related liabilities
Various liabilities
Deferred income and other
Gross deferred tax assets
Deferred tax asset valuation allowances
Net deferred tax assets
Intangible assets, including goodwill
Property, plant and equipment
Other
Gross deferred tax liabilities
Net deferred tax assets (liabilities)
2011
$ 590
259
106
47
137
72
49
1,260
(368)
$ 892
$(147)
(92)
(53)
$(292)
$ 600
2010
$ 335
171
102
50
166
89
97
1,010
(306)
$ 704
$(211)
(108)
(29)
$(348)
$ 356
Form 10-K