Jack In The Box 2009 Annual Report Download - page 20
Download and view the complete annual report
Please find page 20 of the 2009 Jack In The Box annual report below. You can navigate through the pages in the report by either clicking on the pages listed below, or by using the keyword search tool below to find specific information within the annual report.-
 1
1 -
2
-
3
-
4
-
5
-
6
-
7
-
8
-
9
-
 10
10 -
 11
11 -
 12
12 -
 13
13 -
 14
14 -
 15
15 -
 16
16 -
 17
17 -
 18
18 -
 19
19 -
 20
20 -
 21
21 -
 22
22 -
 23
23 -
 24
24 -
 25
25 -
 26
26 -
 27
27 -
 28
28 -
 29
29 -
 30
30 -
31
-
32
-
33
-
34
-
35
-
36
-
37
-
38
-
39
-
40
-
41
-
42
-
43
-
44
-
45
-
46
-
47
-
48
-
49
-
50
-
51
-
52
-
53
-
54
-
55
-
56
-
57
-
58
-
59
-
60
-
61
-
62
-
63
-
64
-
65
-
66
-
67
-
68
-
69
-
70
-
71
-
72
-
73
-
74
-
75
-
76
-
77
-
78
-
79
-
80
-
81
-
82
-
83
-
84
-
85
-
86
-
87
-
88
-
89
-
90
-
91
-
92
-
93
-
94
-
95
-
96
 |
 |

Table of Contents
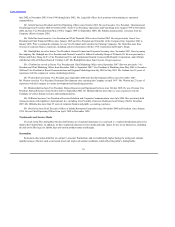
Performance Graph. The following graph compares the cumulative return to holders of the Company’s common stock at
September 30th of each year (except 2004 when the comparison date is October 3 due to the fifty-third week in fiscal 2004) to the yearly
weighted cumulative return of a Restaurant Peer Group Index and to the Standard & Poor’s (“S&P”) 500 Index for the same period. In
2009, we updated the composition of our peer group to maintain consistency with the peer group used by the Company for compensation
purposes. In the year of transition, both the old and new peer groups have been included in the performance graph.
The below comparison assumes $100 was invested on September 30, 2004 in the Company’s common stock and in the comparison
group, and assumes reinvestment of dividends. The Company paid no dividends during these periods.
Jack in the Box Inc. $100 $ 94 $164 $ 204 $ 133 $ 129
S & P 500 Index $100 $112 $ 124 $145 $ 113 $ 105
New Restaurant Peer Group(1) $100 $117 $ 141 $164 $160 $166
Old Restaurant Peer Group(2) $100 $112 $ 131 $122 $ 85 $ 91
(1) Jack in the Box Inc. New Restaurant Peer Group Index is comprised of the following companies: Brinker International, Inc.; CKE
Restaurants, Inc.; Cracker Barrel Old Country Store, Inc.; Darden Restaurants Inc.; DineEquity, Inc.; McDonalds Corp.; Panera
Bread Company; PF Chang’s China Bistro Inc.; Ruby Tuesday, Inc.; Sonic Corp.; Starbucks Corp.; The Cheesecake Factory Inc.;
and Yum! Brands Inc.
(2) Jack in the Box Inc. Old Restaurant Peer Group Index is comprised of the following companies: Brinker International, Inc.; Cracker
Barrel Old Country Store, Inc.; Cheesecake Factory Inc.; CKE Restaurants, Inc.; Darden Restaurants Inc.; Panera Bread Company;
PF Chang’s China Bistro Inc.; Ruby Tuesday, Inc.; Sonic Corp. and Wendys-Arbys Group Inc.
19