Jack In The Box 2005 Annual Report Download - page 13
Download and view the complete annual report
Please find page 13 of the 2005 Jack In The Box annual report below. You can navigate through the pages in the report by either clicking on the pages listed below, or by using the keyword search tool below to find specific information within the annual report.-
 1
1 -
2
-
 3
3 -
 4
4 -
 5
5 -
 6
6 -
 7
7 -
 8
8 -
 9
9 -
 10
10 -
 11
11 -
 12
12 -
 13
13 -
 14
14 -
 15
15 -
 16
16 -
 17
17 -
 18
18 -
 19
19 -
 20
20 -
 21
21 -
 22
22 -
 23
23 -
24
-
25
-
26
-
27
-
28
-
29
-
30
-
31
-
32
-
33
-
34
-
35
-
36
-
37
-
38
-
39
-
40
-
41
-
42
-
43
-
44
-
45
-
46
-
47
-
48
-
49
-
50
-
51
-
52
-
53
-
54
-
55
-
56
-
57
-
58
-
59
-
60
-
61
-
62
-
63
-
64
-
65
-
66
-
67
-
68
-
69
-
70
-
71
-
72
-
73
-
74
-
75
 |
 |

Consolidated Statements of Cash Flows
(Dollars in thousands)
JACK IN THE BOX INC. AND SUBSIDIARIES
FISCAL YEAR
2005 2004 2003
Cash flows from operating activities:
Net earnings $ 91,537 $ 74,684 $ 70,084
Non-cash items included in operations:
Depreciation and amortization 86,156 84,446 76,105
Deferred finance cost amortization 982 1,456 2,849
Deferred income taxes, excluding the effect of the
Qdoba acquisition in 2003 (3,237) 4,023 13,734
Amortization of unearned compensation expense 1,396 584 497
Loss on early retirement of debt — 9,180 —
Impairment charges and other 3,565 933 —
Tax benefit associated with exercise of stock options 9,771 2,867 188
Pension contributions (23,506) (31,214) (5,416)
Gains on the sale of company-operated restaurants (23,334) (17,918) (26,562)
Changes in assets and liabilities, excluding the effect of
the Qdoba acquisition in 2003:
Decrease (increase) in receivables 162 (6,720) (624)
Increase in inventories (5,964) (2,344) (1,573)
Decrease (increase) in prepaid expenses and other
current assets (4,935) (637) 897
Increase (decrease) in accounts payable 2,561 2,695 (9,890)
Increase in other liabilities 19,052 47,616 27,523
Cash flows provided by operating activities 154,206 169,651 147,812
Cash flows from investing activities:
Purchase of property and equipment (123,109) (120,065) (111,872)
Purchase of Qdoba, net of $2,856 cash acquired — — (42,606)
Proceeds from the sale of property and equipment 12,521 10,671 27,198
Proceeds from the sale of company-operated restaurants 33,210 21,486 3,740
Proceeds from (purchase of) assets held for sale
and leaseback, net (21,000) 11,269 (22,642)
Collections on notes receivable 895 21,911 20,092
Purchase of investments and change in cash
surrender value, net (10,411) (9,283) (6,760)
Other (2,944) 16,768 (401)
Cash flows used in investing activities (110,838) (47,243) (133,251)
Cash flows from financing activities:
Borrowings under revolving bank loans — 45,000 510,500
Principal payments under revolving bank loans — (45,000) (544,500)
Proceeds from issuance of debt — 275,000 151,450
Principal payments on debt (8,205) (282,772) (57,632)
Debt issuance and debt repayment costs (343) (7,103) (7,843)
Repurchase of common stock (92,861) (7,138) (50,157)
Proceeds from issuance of common stock 30,049 8,943 363
Cash flows provided by (used in) financing activities (71,360) (13,070) 2,181
Net increase (decrease) in cash and cash equivalents $ (27,992) $ 109,338 $ 16,742
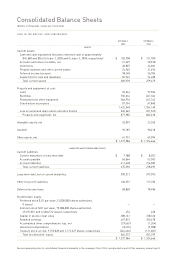
See accompanying notes to consolidated financial statements in the company’s Form 10-K, incorporated as part of this summary annual report.