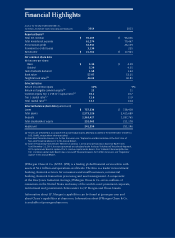
JP Morgan Chase 2014 Annual Report Download - page 9
Download and view the complete annual report
Please find page 9 of the 2014 JP Morgan Chase annual report below. You can navigate through the pages in the report by either clicking on the pages listed below, or by using the keyword search tool below to find specific information within the annual report.-
 1
1 -
 2
2 -
 3
3 -
 4
4 -
 5
5 -
 6
6 -
 7
7 -
 8
8 -
 9
9 -
 10
10 -
 11
11 -
 12
12 -
 13
13 -
 14
14 -
 15
15 -
 16
16 -
 17
17 -
 18
18 -
 19
19 -
 20
20 -
21
-
22
-
23
-
24
-
25
-
26
-
27
-
28
-
29
-
30
-
31
-
32
-
33
-
34
-
35
-
36
-
37
-
38
-
39
-
40
-
41
-
42
-
43
-
44
-
45
-
46
-
47
-
48
-
49
-
50
-
51
-
52
-
53
-
54
-
55
-
56
-
57
-
58
-
59
-
60
-
61
-
62
-
63
-
64
-
65
-
66
-
67
-
68
-
69
-
70
-
71
-
72
-
73
-
74
-
75
-
76
-
77
-
78
-
79
-
80
-
81
-
82
-
83
-
84
-
85
-
86
-
87
-
88
-
89
-
90
-
91
-
92
-
93
-
94
-
95
-
96
-
97
-
98
-
99
-
100
-
101
-
102
-
103
-
104
-
105
-
106
-
107
-
108
-
109
-
110
-
111
-
112
-
113
-
114
-
115
-
116
-
117
-
118
-
119
-
120
-
121
-
122
-
123
-
124
-
125
-
126
-
127
-
128
-
129
-
130
-
131
-
132
-
133
-
134
-
135
-
136
-
137
-
138
-
139
-
140
-
141
-
142
-
143
-
144
-
145
-
146
-
147
-
148
-
149
-
150
-
151
-
152
-
153
-
154
-
155
-
156
-
157
-
158
-
159
-
160
-
161
-
162
-
163
-
164
-
165
-
166
-
167
-
168
-
169
-
170
-
171
-
172
-
173
-
174
-
175
-
176
-
177
-
178
-
179
-
180
-
181
-
182
-
183
-
184
-
185
-
186
-
187
-
188
-
189
-
190
-
191
-
192
-
193
-
194
-
195
-
196
-
197
-
198
-
199
-
200
-
201
-
202
-
203
-
204
-
205
-
206
-
207
-
208
-
209
-
210
-
211
-
212
-
213
-
214
-
215
-
216
-
217
-
218
-
219
-
220
-
221
-
222
-
223
-
224
-
225
-
226
-
227
-
228
-
229
-
230
-
231
-
232
-
233
-
234
-
235
-
236
-
237
-
238
-
239
-
240
-
241
-
242
-
243
-
244
-
245
-
246
-
247
-
248
-
249
-
250
-
251
-
252
-
253
-
254
-
255
-
256
-
257
-
258
-
259
-
260
-
261
-
262
-
263
-
264
-
265
-
266
-
267
-
268
-
269
-
270
-
271
-
272
-
273
-
274
-
275
-
276
-
277
-
278
-
279
-
280
-
281
-
282
-
283
-
284
-
285
-
286
-
287
-
288
-
289
-
290
-
291
-
292
-
293
-
294
-
295
-
296
-
297
-
298
-
299
-
300
-
301
-
302
-
303
-
304
-
305
-
306
-
307
-
308
-
309
-
310
-
311
-
312
-
313
-
314
-
315
-
316
-
317
-
318
-
319
-
320
 |
 |

77
If you think back 10, 20 or 30 years ago, my
predecessors and I struggled to try to build
a great company, which we hoped would
emerge as an endgame winner. The ultimate
outcome was unclear – and many competitors
did not survive (this is true for most large-
scale consolidating industries). Even for those
of us that did, it was quite a struggle. Today,
it is clear that our company is an endgame
winner – both in the United States and glob-
ally – which is invaluable in any industry. And
while we have had some dicult times since
the financial crisis, the power of the franchise
has shone through. We also know that future
success is not guaranteed – only consistently
good management over a long period of time
can ensure long-term success in any business.
But we certainly are in a very good place.
We have delivered good multi-year financial
results (strong margins and returns and
low volatility) and have shown a great
ability to adapt to changes — both from the
marketplace and the regulatory environment
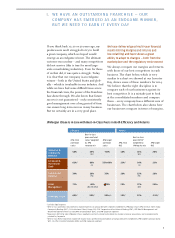
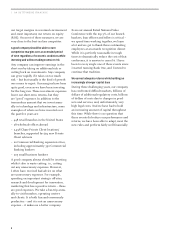
We always compare our margins and returns
with those of our best competitors in each
business. The chart below, which is very
similar to a chart we showed at our Investor
Day, shows some of these numbers for 2014.
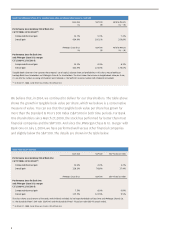
We believe that the right discipline is to
compare each of our businesses against its
best competitor. It is a mistake just to look
at the consolidated numbers and compare
them – every company has a dierent mix of
businesses. The chart below also shows how
our businesses compare in terms of margins,
I. WE HAVE AN OUTSTANDING FRANCHISE — OUR
COMPANY HAS EMERGED AS AN ENDGAME WINNER,
BUT WE NEED TO EARN IT EVERY DAY
JPMorgan Chase Is in Line with Best-in-Class Peers in Both Eciency and Returns
Eciency Returns
JPM 2014
overhead
ratios
Best-in-class
peer overhead
ratios2 weighted
by JPM
revenue mix
JPM target
overhead
ratios
JPM 2014
ROE
Best-in-class
peer ROTCE4
weighted by
JPM equity mix
JPM target
ROE
Consumer &
Community
Banking
58% 55%
WFC
~50% 18% 16%
WFC
20%
Corporate &
Investment
Bank
62%160%
Citi
55%-60% 13%114%
Citi
13%
Commercial
Banking
39% 38%
PNC
35% 18% 13%
PNC
18%
Asset
Management
71% 69%
UBS WM & BLK
≤70% 23% 27%
BEN
25%+
JPMorgan Chase 60%159%155%+/- 13%313% ~15%3
1 Excludes legal expense
2 Best-in-class overhead ratio represents implied expenses of comparable peer segments weighted by JPMorgan Chase (JPM) revenue: Wells Fargo
Community Banking (WFC), Citi Institutional Clients Group (Citi), PNC Corporate and Institutional Banking (PNC), UBS Wealth Management and
Wealth Management Americas (UBS WM) and BlackRock (BLK), and JPM Corporate segment
3 Represents ROTCE for total JPMorgan Chase. Goodwill is primarily related to the Bank One merger and prior acquisitions and is predominantly
retained by Corporate
4 Best-in-class ROTCE represents implied net income minus preferred stock dividends of comparable peers weighted by JPM tangible common equity:
WFC, Citi, PNC, Franklin Templeton (BEN) and JPM Corporate segment