JP Morgan Chase 2014 Annual Report Download - page 11
Download and view the complete annual report
Please find page 11 of the 2014 JP Morgan Chase annual report below. You can navigate through the pages in the report by either clicking on the pages listed below, or by using the keyword search tool below to find specific information within the annual report.-
 1
1 -
 2
2 -
 3
3 -
 4
4 -
 5
5 -
 6
6 -
 7
7 -
 8
8 -
 9
9 -
 10
10 -
 11
11 -
 12
12 -
 13
13 -
 14
14 -
 15
15 -
 16
16 -
 17
17 -
 18
18 -
 19
19 -
 20
20 -
 21
21 -
 22
22 -
23
-
24
-
25
-
26
-
27
-
28
-
29
-
30
-
31
-
32
-
33
-
34
-
35
-
36
-
37
-
38
-
39
-
40
-
41
-
42
-
43
-
44
-
45
-
46
-
47
-
48
-
49
-
50
-
51
-
52
-
53
-
54
-
55
-
56
-
57
-
58
-
59
-
60
-
61
-
62
-
63
-
64
-
65
-
66
-
67
-
68
-
69
-
70
-
71
-
72
-
73
-
74
-
75
-
76
-
77
-
78
-
79
-
80
-
81
-
82
-
83
-
84
-
85
-
86
-
87
-
88
-
89
-
90
-
91
-
92
-
93
-
94
-
95
-
96
-
97
-
98
-
99
-
100
-
101
-
102
-
103
-
104
-
105
-
106
-
107
-
108
-
109
-
110
-
111
-
112
-
113
-
114
-
115
-
116
-
117
-
118
-
119
-
120
-
121
-
122
-
123
-
124
-
125
-
126
-
127
-
128
-
129
-
130
-
131
-
132
-
133
-
134
-
135
-
136
-
137
-
138
-
139
-
140
-
141
-
142
-
143
-
144
-
145
-
146
-
147
-
148
-
149
-
150
-
151
-
152
-
153
-
154
-
155
-
156
-
157
-
158
-
159
-
160
-
161
-
162
-
163
-
164
-
165
-
166
-
167
-
168
-
169
-
170
-
171
-
172
-
173
-
174
-
175
-
176
-
177
-
178
-
179
-
180
-
181
-
182
-
183
-
184
-
185
-
186
-
187
-
188
-
189
-
190
-
191
-
192
-
193
-
194
-
195
-
196
-
197
-
198
-
199
-
200
-
201
-
202
-
203
-
204
-
205
-
206
-
207
-
208
-
209
-
210
-
211
-
212
-
213
-
214
-
215
-
216
-
217
-
218
-
219
-
220
-
221
-
222
-
223
-
224
-
225
-
226
-
227
-
228
-
229
-
230
-
231
-
232
-
233
-
234
-
235
-
236
-
237
-
238
-
239
-
240
-
241
-
242
-
243
-
244
-
245
-
246
-
247
-
248
-
249
-
250
-
251
-
252
-
253
-
254
-
255
-
256
-
257
-
258
-
259
-
260
-
261
-
262
-
263
-
264
-
265
-
266
-
267
-
268
-
269
-
270
-
271
-
272
-
273
-
274
-
275
-
276
-
277
-
278
-
279
-
280
-
281
-
282
-
283
-
284
-
285
-
286
-
287
-
288
-
289
-
290
-
291
-
292
-
293
-
294
-
295
-
296
-
297
-
298
-
299
-
300
-
301
-
302
-
303
-
304
-
305
-
306
-
307
-
308
-
309
-
310
-
311
-
312
-
313
-
314
-
315
-
316
-
317
-
318
-
319
-
320
 |
 |

99
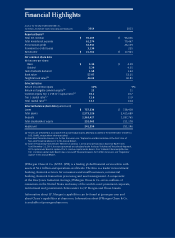
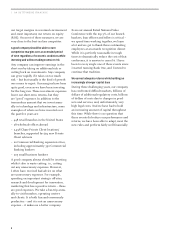
I. AN OUTSTANDING FRANCHISE
The chart below shows earnings, the capital
we returned to shareholders through divi-
dends and stock buybacks, our returns
on tangible common equity and our high
quality liquid assets (HQLA). High quality
liquid assets essentially are deposits held
at the Federal Reserve and central banks,
agency mortgage-backed securities and
Treasuries, and they are the component
of our balance sheet that has grown most
dramatically. Only HQLA count for liquid
assets under banking regulators’ definition of
liquidity – and we currently have more than
is required by the regulators.
The chart below also shows that even
after dramatically increasing capital and
liquidity, both of which reduce returns on
capital, we were able to earn an adequate
return on tangible common equity, grow
our capital base as needed and still return
capital to shareholders.
Capital, Liquidity, Returns
($ in billions, except ratios)
2017+2016201520142013201220112010
7.0 %
7.9%
8.7%
9.5%
10.2%
11.0% 11.5% 12.0%+
Earnings $ 17 $ 19 $ 21 $ 18 $ 22
Total capital returned2 4 13 6 10 11
HQLA NA NA 341 522 600
ROTCE 15% 15% 15% 11% 13%
Glidepath3
Basel III common equity Tier 1 capital ratio (CET1)1
1 Basel III rules became eective on January 1, 2014. The ratios presented for 2010-2014 are calculated under the Basel III Advanced Fully
Phased-In Approach and, for 2010-2013, reflect the firm’s best estimate based on its understanding of the rules in the relevant period
2 Represents common dividends plus stock buybacks, which are gross of employee issuance
3 Reflects the firm’s Basel III CET1 ratio glidepath for 2015-2017+