JP Morgan Chase 2005 Annual Report Download - page 3
Download and view the complete annual report
Please find page 3 of the 2005 JP Morgan Chase annual report below. You can navigate through the pages in the report by either clicking on the pages listed below, or by using the keyword search tool below to find specific information within the annual report.-
 1
1 -
 2
2 -
 3
3 -
 4
4 -
 5
5 -
 6
6 -
 7
7 -
 8
8 -
 9
9 -
 10
10 -
 11
11 -
 12
12 -
 13
13 -
 14
14 -
15
-
16
-
17
-
18
-
19
-
20
-
21
-
22
-
23
-
24
-
25
-
26
-
27
-
28
-
29
-
30
-
31
-
32
-
33
-
34
-
35
-
36
-
37
-
38
-
39
-
40
-
41
-
42
-
43
-
44
-
45
-
46
-
47
-
48
-
49
-
50
-
51
-
52
-
53
-
54
-
55
-
56
-
57
-
58
-
59
-
60
-
61
-
62
-
63
-
64
-
65
-
66
-
67
-
68
-
69
-
70
-
71
-
72
-
73
-
74
-
75
-
76
-
77
-
78
-
79
-
80
-
81
-
82
-
83
-
84
-
85
-
86
-
87
-
88
-
89
-
90
-
91
-
92
-
93
-
94
-
95
-
96
-
97
-
98
-
99
-
100
-
101
-
102
-
103
-
104
-
105
-
106
-
107
-
108
-
109
-
110
-
111
-
112
-
113
-
114
-
115
-
116
-
117
-
118
-
119
-
120
-
121
-
122
-
123
-
124
-
125
-
126
-
127
-
128
-
129
-
130
-
131
-
132
-
133
-
134
-
135
-
136
-
137
-
138
-
139
-
140
-
141
-
142
-
143
-
144
 |
 |

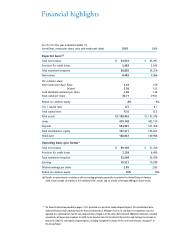
Financial highlights
*The financial information provided on pages 2-20 is presented on a pro forma combined-operating basis. The unaudited pro forma
combined historical results represent how the financial information of JPMorgan Chase & Co. and Bank One Corporation may have
appeared on a combined basis had the two companies been merged as of the earliest date indicated. Additional information, including
reconciliation of the pro forma numbers to GAAP, can be found on Form 8-K furnished to the Securities and Exchange Commission on
January 18, 2006. For a description of operating basis, including management’s reasons for its use of such measures, see page 31 of
this Annual Report.
As of or for the year ended December 31,
(in millions, except per share, ratio and headcount data) 2005 2004
Reported basis(a)
Total net revenue $54,533 $43,097
Provision for credit losses 3,483 2,544
Total noninterest expense 38,835 34,359
Net income 8,483 4,466
Per common share:
Net income per share: Basic 2.43 1.59
Diluted 2.38 1.55
Cash dividends declared per share 1.36 1.36
Book value per share 30.71 29.61
Return on common equity 8% 6%
Tier 1 capital ratio 8.5 8.7
Total capital ratio 12.0 12.2
Total assets $1,198,942 $1,157,248
Loans 419,148 402,114
Deposits 554,991 521,456
Total stockholders’ equity 107,211 105,653
Headcount 168,847 160,968
Operating basis (pro forma)*
Total net revenue $59,149 $57,760
Provision for credit losses 7,259 6,490
Total noninterest expense 35,549 35,439
Earnings 10,521 10,289
Diluted earnings per share 2.95 2.85
Return on common equity 10% 10%
(a) Results are presented in accordance with accounting principles generally accepted in the United States of America.
2004 results include six months of the combined Firm’s results and six month of heritage JPMorgan Chase results.