JCPenney 2005 Annual Report Download - page 2
Download and view the complete annual report
Please find page 2 of the 2005 JCPenney annual report below. You can navigate through the pages in the report by either clicking on the pages listed below, or by using the keyword search tool below to find specific information within the annual report.-
 1
1 -
 2
2 -
 3
3 -
 4
4 -
 5
5 -
 6
6 -
 7
7 -
 8
8 -
 9
9 -
 10
10 -
 11
11 -
 12
12 -
 13
13 -
14
-
15
-
16
-
17
-
18
-
19
-
20
 |
 |

inside
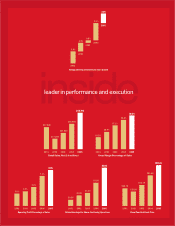
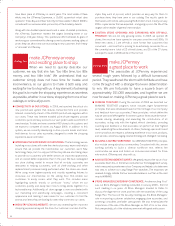
leader in performance and execution
Operating Profit Percentage of Sales
3.0%
3.9%
4.4%
7.1%
8
8.
.4
4%
%
Retail Sales, Net ($ in millions)
$17,840
2001 2002 2003 2004 2005
2001 2002 2003 2004 2005 2001 2002 2003 2004 2005
2001 2002 2003 2004 2005 2001 2002 2003 2004 2005
$17,384
$17,513
$18,096
Fiscal Year-End Stock Price
$23.70
$19.39
$26.18
$41.69
$
$5
56
6.
.2
21
1
Diluted Earnings Per Share–Continuing Operations
$0.58
$0.95
$1.20
$2.20
$
$3
3.
.8
83
3
Gross Margin Percentage of Sales
33.5%
35.8%
37.1%
38.6%
3
39
9.
.3
3%
%
2002
2003
2004
2005
2
2.
.9
9%
%
0.8%
2.8%
2001
3.8%
$
$1
18
8,
,7
78
81
1
4.9%
Comparable Department Store Sales Growth