JCPenney 2005 Annual Report Download - page 15
Download and view the complete annual report
Please find page 15 of the 2005 JCPenney annual report below. You can navigate through the pages in the report by either clicking on the pages listed below, or by using the keyword search tool below to find specific information within the annual report.-
 1
1 -
2
-
3
-
4
-
 5
5 -
 6
6 -
 7
7 -
 8
8 -
 9
9 -
 10
10 -
 11
11 -
 12
12 -
 13
13 -
 14
14 -
 15
15 -
 16
16 -
 17
17 -
 18
18 -
 19
19 -
 20
20
 |
 |

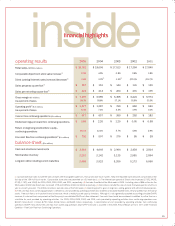
operating results
Retail sales, net ($ in millions)
Comparable department store sales increase(1)
Direct (catalog/Internet) sales increase/(decrease)(2)
Sales per gross square foot(4)
Sales per net selling square foot(4)
Gross margin ($ in millions)
As a percent of sales
Operating profit(5)($ in millions)
As a percent of sales
Income from continuing operations ($ in millions)
Diluted earnings per share from continuing operations
Return on beginning stockholders’ equity –
continuing operations
Free cash flow from continuing operations(6 )($ in millions)
balance sheet ($ in millions)
Cash and short-term investments
Merchandise inventory
Long-term debt, including current maturities
2005
$ 18,781
2.9%
3.6%
$ 157
$ 221
$7,376
39.3%
$ 1,577
8.4%
$ 977
$3.83
20.1%
$702
$ 3,016
3,210
3,465
2004
$ 18,096
4.9%
3.3%
$ 151
$ 214
$6,989
38.6%
$ 1,287
7.1%
$ 657
$2.20
12.1%
$597
$ 4,649
3,142
3,923
2003
$ 17,513
0.8%
1.5%
$ 144
$ 204
$6,498
37.1%
$ 769
4.4%
$ 360
$1.20
5.7%
$376
$ 2,964
3,135
5,356
2002
$ 17,384
2.8%
(22.0)%
$ 141
$ 201
$6,224
35.8%
$ 683
3.9%
$ 283
$0.95
4.6%
$86
$ 2,454
2,955
5,173
2001
$ 17,840
3.8%
(19.7)%
$ 135
$ 195
$5,974
33.5%
$ 540
3.0%
$ 183
$0.58
2.9%
$38
$ 2,814
2,894
6,060
(1) Comparable store sales include the sales of stores after having been open for 12 full consecutive fiscal months. New and relocated stores become comparable on the
first day of the 13th full fiscal month. Comparable storesales arepresented on a 52-week basis. (2) The Internet component of Direct sales increased 27.9%, 34.0%,
47.9%, 17.3%, and 10.6% for 2005, 2004, 2003, 2002, and 2001, respectively. (3) Excludes the effect of the 53rd week in 2003. Including sales of $46 million for the
53rd week in 2003, total Direct sales increased 1.5% and 3.3% for 2004 and 2003, respectively. (4) Calculations include the sales of stores that were open for a full fiscal
year as of each year end. The 2003 calculations exclude sales of the 53rd week. (5) Operating profit is gross margin less selling, general and administrative expenses.
(6) Free cash flow from continuing operations is defined as cash provided by operating activities less dividends and capital expenditures, net of proceeds from the sale of
assets. Free cash flow is an important financial measure, which is widely focused upon by investors. Although it is not a generally accepted accounting principle (GAAP)
measure, it is derived from components of the Company’s consolidated GAAP cash flow statement. Free cash flow should be considered in addition to, rather than as a
substitute for, cash provided by operating activities. For 2005, 2004, 2003, 2002, and 2001, cash provided by operating activities from continuing operations was
$1,337 million, $1,111 million, $795 million, $516 million, and $443 million, respectively. A reconciliation of cash provided by operating activities from continuing
operations (GAAP measure) to free cash flow from continuing operations (non-GAAP measure) is provided in the 2005 Annual Report on Form 10-K under Financial
Condition – Free Cash Flow from Continuing Operations.
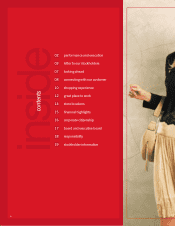
inside
financial highlights
15
(3) (3)