Intel 1995 Annual Report Download - page 24
Download and view the complete annual report
Please find page 24 of the 1995 Intel annual report below. You can navigate through the pages in the report by either clicking on the pages listed below, or by using the keyword search tool below to find specific information within the annual report.-
 1
1 -
2
-
3
-
4
-
5
-
6
-
7
-
8
-
9
-
10
-
11
-
12
-
13
-
 14
14 -
 15
15 -
 16
16 -
 17
17 -
 18
18 -
 19
19 -
 20
20 -
 21
21 -
 22
22 -
 23
23 -
 24
24 -
 25
25 -
 26
26 -
 27
27 -
 28
28 -
 29
29 -
 30
30 -
 31
31 -
 32
32 -
 33
33 -
 34
34 -
35
-
36
-
37
-
38
-
39
-
40
-
41
 |
 |
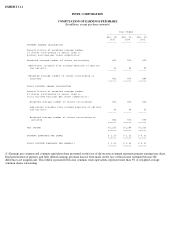
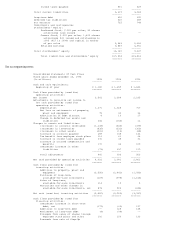
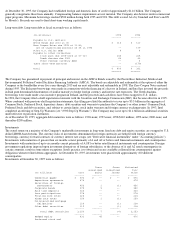
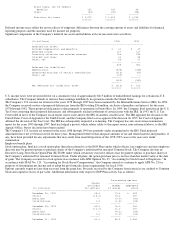
Derivative financial instruments
Outstanding notional amounts for derivative financial instruments at fiscal year-ends were as follows:
While the contract or notional amounts provide one measure of the volume of these transactions, they do not represent the amount of the
Company's exposure to credit risk. The amounts potentially subject to credit risk (arising from the possible inability of counterparties to meet
the terms of their contracts) are generally limited to the amounts, if any, by which the counterparties' obligations exceed the obligations of the
Company. The Company controls credit risk through credit approvals, limits and monitoring procedures. Credit rating criteria for off-balance-
sheet transactions are similar to those for investments.
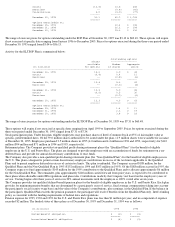
Swap agreements. The Company utilizes swap agreements to exchange the foreign currency, equity, and interest rate returns of its investment
and debt portfolios for a floating U.S. dollar interest rate based return. The floating rates on swaps are based primarily on U.S. dollar LIBOR
and reset on a monthly, quarterly or semiannual basis.
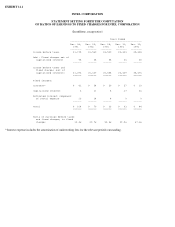
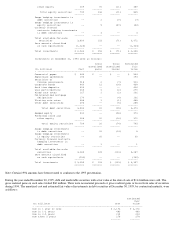
Weighted average pay and receive rates, average maturities and range of maturities on swaps at December 30, 1995 were as follows:
Note: Pay and receive rates are based on the reset rates that were in effect at December 30, 1995.
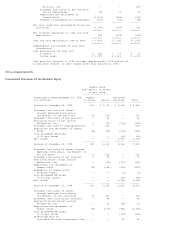
Pay rates on swaps hedging investments in debt securities generally match the yields on the underlying investments they hedge. Payments on
swaps hedging investments in equity securities generally match the equity returns on the underlying investments they hedge. Receive rates on
swaps hedging debt generally match the expense on the underlying debt they hedge. Maturity dates of swaps generally match those of the
underlying investment or the debt they hedge. There is approximately a one-to-one matching of investments and debt to swaps. Swap
agreements generally remain in effect until expiration. Income or expense on swaps is accrued as an adjustment to the yield of the related
investments or debt they hedge.
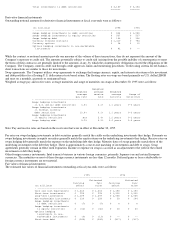
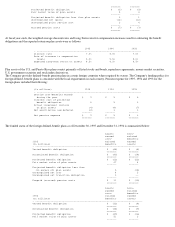
Other foreign currency instruments. Intel transacts business in various foreign currencies, primarily Japanese yen and certain European
currencies. The maturities on most of these foreign currency instruments are less than 12 months. Deferred gains or losses attributable to
foreign currency instruments are not material.
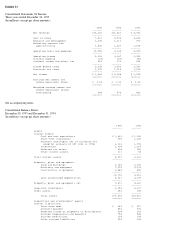
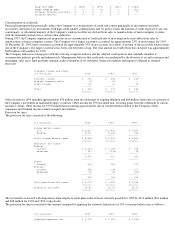
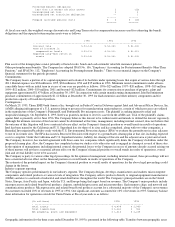
Fair values of financial instruments
The estimated fair values of financial instruments outstanding at fiscal year-ends were as follows:
Total investments in debt securities $ 3,150 $ 3,153
======= =======
(In millions) 1995 1994
- ------------------------------------------------------------------------------
Swaps hedging investments in debt securities $ 824 $ 1,080
Swaps hedging investments in equity securities $ 567 $ 567
Swaps hedging debt $ 156 $ 156
Currency forward contracts $ 1,310 $ 784
Currency options $ 28 $ 10
Options hedging investments in non-marketable
instruments $ 82 $ --
Weighted
Weighted average Weighted
average receive average Range of
pay rate rate maturity maturities
- -------------------------------------------------------------------------------
Swaps hedging investments
in U.S. dollar debt securities 6.5% 6.2% 1.1 years 0-3 years
Swaps hedging investments
in foreign currency
debt securities 10.4% 9.1% 1.1 years 0-3 years
Swaps hedging investments
in equity securities N/A 5.4% 1.2 years 0-2 years
Swaps hedging debt 5.9% 5.2% 3.6 years 3-6 years
1995 1994
--------------------- ---------------------
Estimated Estimated
Carrying fair Carrying fair
(In millions) amount value amount value
- ---------------------------------------------------------------------------
Cash and cash equivalents $ 1,463 $ 1,463 $ 1,180 $ 1,180
Short-term investments $ 995 $ 995 $ 1,230 $ 1,230
Long-term investments $ 1,699 $ 1,699 $ 2,058 $ 2,058
Non-marketable instruments $ 239 $ 259 $ 59 $ 144
Swaps hedging investments
in debt securities $ (7) $ (7) $ 8 $ 8
Swaps hedging investments
in equity securities $ (42) $ (42) $ 60 $ 60
Options hedging
investments in non-
marketable instruments $ (9) $ (13) $ -- $ --
Short-term debt $ (346) $ (346) $ (517) $ (517)