Hibbett Sports 2012 Annual Report Download - page 2
Download and view the complete annual report
Please find page 2 of the 2012 Hibbett Sports annual report below. You can navigate through the pages in the report by either clicking on the pages listed below, or by using the keyword search tool below to find specific information within the annual report.-
 1
1 -
 2
2 -
 3
3 -
 4
4 -
 5
5 -
 6
6 -
 7
7 -
 8
8 -
 9
9 -
 10
10 -
 11
11 -
 12
12 -
 13
13 -
14
-
15
-
16
-
17
-
18
-
19
-
20
-
21
-
22
-
23
-
24
-
25
-
26
-
27
-
28
-
29
-
30
-
31
-
32
-
33
-
34
-
35
-
36
-
37
-
38
-
39
-
40
-
41
-
42
-
43
-
44
-
45
-
46
-
47
-
48
-
49
-
50
-
51
-
52
-
53
-
54
-
55
-
56
-
57
-
58
-
59
-
60
-
61
-
62
-
63
-
64
-
65
-
66
 |
 |

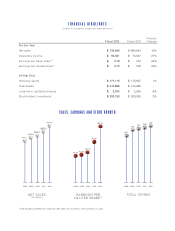
(1)All fiscal years presented are comprised of 52 weeks. No dividends were declared or paid.
Percent
Fiscal 2012 Fiscal 2011 Change
For the Year
Net sales $ 732,645 $ 664,954 10%
Operating income $ 093,531 $ 073,547 27%
Earnings per basic share(1) $ 0002.19 $ 0001.63 34%
Earnings per diluted share(1) $ 0002.15 $ 0001.60 34%
At Year End
Working capital $ 177,115 $ 175,007 1%
Total assets $ 313,696 $ 314,265 –%
Long-term capitalized leases $ 0,02,072 $ 0,02,245 -8%
Stockholders’ investment $ 203,750 $ 200,088 2%
F I N A N C I A L H I G H L I G H T S
(Dollars in thousands, except per share amounts)
S A L E S , E A R N I N G S A N D S T O R E G R O W T H
$520.7
2008
$564.2
2009
$593.5
2010 2011
$732.6
2012
$0.96
2008
$1.02
2009
$1.12
2010
$1.60
2011 2012
688
2008
745
2009
767
2010
798
2011
832
2012
NET SALES
(In Millions)
EARNINGS PER
DILUTED SHARE(1)
TOTAL STORES
$665.0
$2.15