Henry Schein 2009 Annual Report Download - page 4
Download and view the complete annual report
Please find page 4 of the 2009 Henry Schein annual report below. You can navigate through the pages in the report by either clicking on the pages listed below, or by using the keyword search tool below to find specific information within the annual report.-
 1
1 -
 2
2 -
 3
3 -
 4
4 -
 5
5 -
 6
6 -
 7
7 -
 8
8 -
 9
9 -
 10
10 -
 11
11 -
 12
12 -
 13
13 -
 14
14 -
 15
15 -
16
-
17
-
18
-
19
-
20
-
21
-
22
-
23
-
24
-
25
-
26
-
27
-
28
-
29
-
30
-
31
-
32
-
33
-
34
-
35
-
36
-
37
-
38
-
39
-
40
-
41
-
42
-
43
-
44
-
45
-
46
-
47
-
48
-
49
-
50
-
51
-
52
-
53
-
54
-
55
-
56
-
57
-
58
-
59
-
60
-
61
-
62
-
63
-
64
-
65
-
66
-
67
-
68
-
69
-
70
-
71
-
72
-
73
-
74
-
75
-
76
-
77
-
78
-
79
-
80
-
81
-
82
-
83
-
84
-
85
-
86
-
87
-
88
-
89
-
90
-
91
-
92
-
93
-
94
-
95
-
96
-
97
-
98
-
99
-
100
-
101
-
102
-
103
-
104
-
105
-
106
-
107
-
108
-
109
-
110
-
111
-
112
-
113
-
114
-
115
-
116
-
117
-
118
-
119
-
120
-
121
-
122
-
123
-
124
-
125
-
126
-
127
 |
 |

2
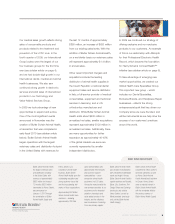
NET SALES
from Continuing Operations
($ in Millions)
OPERATING INCOME
from Continuing Operations
($ in Millions)
EARNINGS PER DILUTED SHARE
from Continuing Operations
attributable to Henry Schein, Inc.
OPERATING CASH FLOW
AND CAPITAL EXPENDITURES
($ in Millions)
CAGR 18%*
*Five-year Compound Annual Growth Rate
CAGR 18%*
CAGR 12%*
NOTE:
Operating Income and Earnings Per Diluted Share from Continuing Operations attributable to Henry Schein, Inc. have been
adjusted to exclude certain one-time items. Refer to Non-GAAP Disclosures on page 10. Additionally, refer to our annual
consolidated financial statements for a complete presentation of our Consolidated Statements of Cash Flows.
FINANCIAL HIGHLIGHTS