Health Net 2011 Annual Report Download - page 5
Download and view the complete annual report
Please find page 5 of the 2011 Health Net annual report below. You can navigate through the pages in the report by either clicking on the pages listed below, or by using the keyword search tool below to find specific information within the annual report.-
 1
1 -
 2
2 -
 3
3 -
 4
4 -
 5
5 -
 6
6 -
 7
7 -
 8
8 -
 9
9 -
 10
10 -
 11
11 -
 12
12 -
 13
13 -
 14
14 -
 15
15 -
 16
16 -
17
-
18
-
19
-
20
-
21
-
22
-
23
-
24
-
25
-
26
-
27
-
28
-
29
-
30
-
31
-
32
-
33
-
34
-
35
-
36
-
37
-
38
-
39
-
40
-
41
-
42
-
43
-
44
-
45
-
46
-
47
-
48
-
49
-
50
-
51
-
52
-
53
-
54
-
55
-
56
-
57
-
58
-
59
-
60
-
61
-
62
-
63
-
64
-
65
-
66
-
67
-
68
-
69
-
70
-
71
-
72
-
73
-
74
-
75
-
76
-
77
-
78
-
79
-
80
-
81
-
82
-
83
-
84
-
85
-
86
-
87
-
88
-
89
-
90
-
91
-
92
-
93
-
94
-
95
-
96
-
97
-
98
-
99
-
100
-
101
-
102
-
103
-
104
-
105
-
106
-
107
-
108
-
109
-
110
-
111
-
112
-
113
-
114
-
115
-
116
-
117
-
118
-
119
-
120
-
121
-
122
-
123
-
124
-
125
-
126
-
127
-
128
-
129
-
130
-
131
-
132
-
133
-
134
-
135
-
136
-
137
-
138
-
139
-
140
-
141
-
142
-
143
-
144
-
145
-
146
-
147
-
148
-
149
-
150
-
151
-
152
-
153
-
154
-
155
-
156
-
157
-
158
-
159
-
160
-
161
-
162
-
163
-
164
-
165
-
166
-
167
-
168
-
169
-
170
-
171
-
172
-
173
-
174
-
175
-
176
-
177
-
178
-
179
-
180
-
181
-
182
-
183
-
184
-
185
-
186
-
187
-
188
-
189
-
190
-
191
-
192
-
193
-
194
-
195
-
196
-
197
-
198
-
199
-
200
-
201
-
202
-
203
-
204
-
205
-
206
-
207
-
208
-
209
-
210
-
211
-
212
-
213
-
214
-
215
-
216
-
217
-
218
-
219
-
220
-
221
-
222
-
223
-
224
-
225
-
226
-
227
-
228
-
229
-
230
-
231
-
232
-
233
-
234
-
235
-
236
-
237
-
238
-
239
-
240
-
241
-
242
-
243
-
244
-
245
-
246
-
247
-
248
-
249
-
250
-
251
-
252
-
253
-
254
-
255
-
256
-
257
-
258
-
259
-
260
-
261
-
262
-
263
-
264
-
265
-
266
-
267
-
268
-
269
-
270
-
271
-
272
-
273
-
274
-
275
-
276
-
277
-
278
-
279
-
280
-
281
-
282
-
283
-
284
-
285
-
286
-
287
-
288
-
289
-
290
-
291
-
292
-
293
-
294
-
295
-
296
-
297
-
298
-
299
-
300
-
301
-
302
-
303
-
304
-
305
-
306
-
307
 |
 |

quality tailored networks to meet this need. These tailored network products use provider networks that share our
commitment to quality health care combined with affordability for our members. These products also incorporate
benefit levels that ensure our members have access to the care they need.
We offer tailored network HMO products throughout our Western Region Operations. These networks can
be structured in a variety of ways, including a tiered provider option based on cost and quality, products tailored
to targeted populations and networks organized in conjunction with a strategic provider partner. For example, our
HMO Silver Network is a network of HMO doctors, specialists and hospitals in ten counties in California. Our
Salud Con Health NetSM product line is a suite of affordable plans targeting the Latino community. It is our
fastest growing tailored network product in our Western Region Operations. Our PremierCareSM HMO is a
tailored network built on a new strategic provider partnership with Sutter Health in Northern California.
PremierCare provides lower-cost premiums for employers as their employees access medical care through the
Sutter Health system of hospitals, primary care physicians and specialists. We have also developed tailored
network products with strategic provider partners in Phoenix, Arizona and Portland, Oregon. We have also
developed products for key employer groups with a large geographic distribution within a particular state.
We assume both underwriting and administrative expense risk in return for the premium revenue we receive
from our HMO, POS and PPO products. We have contractual relationships with health care providers for the
delivery of health care to our enrollees in these products.
In California, we utilize a “capitation” fee model. Under a capitation fee model, we pay a provider group a
fixed amount per member on a regular basis, usually monthly, and the provider group accepts the risk of the
frequency and cost of member utilization of professional services. By incentivizing providers to focus on cost
management, members are more likely to receive only those services that they actually need rather than extraneous
services that drive up costs without any meaningful corresponding health benefit. See “—Provider Relationships”
for additional information about our capitation fee arrangements. As of December 31, 2011, approximately 81% of
our California commercial membership was enrolled in capitated medical groups. In addition, approximately 99%
of our Medicare and 74% of our Medicaid businesses are linked to capitated provider groups.
As of December 31, 2011, with respect to our Western Region Operations segment, 57% of our commercial
members were covered by conventional HMO products, 41% were covered by POS and PPO products, and 2%
were covered by other related products.
Membership in our tailored network products was approximately 31% of total commercial risk membership
as of December 31, 2011, compared with 23% as of December 31, 2010. As of December 31, 2011, more than
46% of our California commercial capitated membership was enrolled in tailored network products.
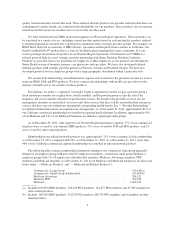
The following table contains membership information relating to our commercial large group (generally
defined as an employer group with more than 50 employees) members, commercial small group (defined as
employer groups with 2 to 50 employees) and individual members, Medicare Advantage members, PDP
members and Medicaid members as of December 31, 2011 (our Medicare and Medicaid businesses are discussed
below under “—Medicare Products” and “—Medicaid and Related Products”):
Commercial—Large Group ............................................ 952,610(a)
Commercial—Small Group & Individual ................................. 413,003(b)
Medicare Advantage ................................................. 204,912
Medicare PDP ...................................................... 382,396
Medicaid .......................................................... 1,008,915
(a) Includes 603,870 HMO members, 196,658 POS members, 124,677 PPO members and 27,405 members in
other related products.
(b) Includes 168,402 HMO members, 35,023 POS members, 209,574 PPO members and 4 members in other
related products.
3