Health Net 2002 Annual Report Download - page 3
Download and view the complete annual report
Please find page 3 of the 2002 Health Net annual report below. You can navigate through the pages in the report by either clicking on the pages listed below, or by using the keyword search tool below to find specific information within the annual report.-
 1
1 -
 2
2 -
 3
3 -
 4
4 -
 5
5 -
 6
6 -
 7
7 -
 8
8 -
 9
9 -
 10
10 -
 11
11 -
 12
12 -
 13
13 -
 14
14 -
15
-
16
-
17
-
18
-
19
-
20
-
21
-
22
-
23
-
24
-
25
-
26
-
27
-
28
-
29
-
30
-
31
-
32
-
33
-
34
-
35
-
36
-
37
-
38
-
39
-
40
-
41
-
42
-
43
-
44
-
45
-
46
-
47
-
48
-
49
-
50
-
51
-
52
-
53
-
54
-
55
-
56
-
57
-
58
-
59
-
60
-
61
-
62
-
63
-
64
-
65
-
66
-
67
-
68
-
69
-
70
-
71
-
72
-
73
-
74
-
75
-
76
-
77
-
78
-
79
-
80
-
81
-
82
-
83
-
84
-
85
-
86
-
87
-
88
-
89
-
90
 |
 |

HEALTH NET, INC. | 1
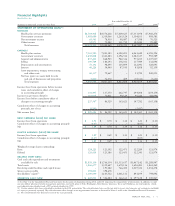
Financial Highlights
Health Net, Inc.
Year ended December 31,
(Amounts in thousands, except per share data) 2002 2001(2) 2000(2) 1999(2) 1998(2)
STATEMENT OF OPERATIONS DATA(1):
REVENUES
Health plan services premiums $8,584,418 $8,576,202 $7,609,625 $7,353,958 $7,460,276
Government contracts 1,498,689 1,339,066 1,265,124 1,104,101 998,581
Net investment income 65,561 78,910 90,087 67,588 70,523
Other income 52,875 70,282 111,719 122,240 99,489
Total revenues 10,201,543 10,064,460 9,076,555 8,647,887 8,628,869
EXPENSES
Health plan services 7,161,520 7,241,185 6,322,691 6,061,642 6,196,596
Government contracts 1,450,808 1,321,483 1,196,532 1,082,317 992,589
General and administrative 857,201 868,925 942,316 973,235 1,107,037
Selling 199,764 186,143 158,031 137,444 132,096
Depreciation and amortization 70,192 98,695 105,899 112,041 128,093
Interest 40,226 54,940 87,930 83,808 92,159
Asset impairment, merger, restructuring
and other costs 60,337 79,667 – 11,724 240,053
Net loss (gain) on assets held for sale
and sale of businesses and properties 5,000 76,072 409 (58,332) (5,600)
Total expenses 9,845,048 9,927,110 8,813,808 8,403,879 8,883,023
Income (loss) from operations before income
taxes and cumulative effect of changes
in accounting principle 356,495 137,350 262,747 244,008 (254,154)
Income tax provision (benefit) 118,928 50,821 99,124 96,226 (88,996)
Income (loss) before cumulative effect of
changes in accounting principle 237,567 86,529 163,623 147,782 (165,158)
Cumulative effect of changes in accounting
principle, net of tax (8,941) ––(5,417) –
Net income (loss) $228,626 $86,529 $ 163,623 $ 142,365 $ (165,158)
BASIC EARNINGS (LOSS) PER SHARE:
Income (loss) from operations $ 1.91 $0.70 $ 1.34 $ 1.21 $ (1.35)
Cumulative effect of changes in accounting principle (0.07) ––(0.05) –
Net $ 1.84 $ 0.70 $ 1.34 $ 1.16 $ (1.35)
DILUTED EARNINGS (LOSS) PER SHARE:
Income (loss) from operations $ 1.89 $0.69 $ 1.33 $ 1.21 $ (1.35)
Cumulative effect of changes in accounting principle (0.07) ––(0.05) –
Net $ 1.82 $0.69 $ 1.33 $ 1.16 $ (1.35)
Weighted average shares outstanding:
Basic 124,221 123,192 122,471 122,289 121,974
Diluted 126,004 125,186 123,453 122,343 121,974
BALANCE SHEET DATA:
Cash and cash equivalents and investments
available for sale $1,850,139 $1,766,154 $1,533,637 $1,467,142 $ 1,288,947
Total assets 3,466,677 3,559,647 3,670,116 3,696,481 3,863,269
Revolving credit facilities and capital leases –195,182 766,450 1,039,352 1,254,278
Senior notes payable 398,821 398,678 – – –
Stockholders’ equity(3) 1,309,049 1,165,512 1,061,131 891,199 744,042
OPERATING CASH FLOW $ 420,023 $546,484 $ 366,163 $ 297,128 $ 100,867
(1) See Note 3 to the Consolidated Financial Statements for discussion of dispositions during 2002 and 2001 impacting the comparability of information. In addition, we sold
our non-affiliate pharmacy benefits management operations, our health plans in Utah, Washington, New Mexico, Louisiana, Texas and Oklahoma, our two hospitals, a third-
party administrator subsidiary and a PPO network subsidiary in 1999.
(2) Certain amounts have been reclassified to conform to the 2002 presentation. The reclassifications have no effect on total revenues, total expenses, net earnings or stockhold-
ers’ equity as previously reported. The reclassifications reflect changes in our organizational structure as discussed in Notes 1 and 2 to the Consolidated Financial Statements.
(3) No cash dividends were declared in each of the years presented.