Hamilton Beach 2012 Annual Report Download - page 9
Download and view the complete annual report
Please find page 9 of the 2012 Hamilton Beach annual report below. You can navigate through the pages in the report by either clicking on the pages listed below, or by using the keyword search tool below to find specific information within the annual report.-
 1
1 -
 2
2 -
 3
3 -
 4
4 -
 5
5 -
 6
6 -
 7
7 -
 8
8 -
 9
9 -
 10
10 -
 11
11 -
 12
12 -
 13
13 -
 14
14 -
 15
15 -
 16
16 -
 17
17 -
 18
18 -
 19
19 -
 20
20 -
21
-
22
-
23
-
24
-
25
-
26
-
27
-
28
-
29
 |
 |

7
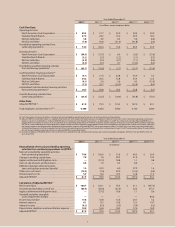
(6) Cash Flow before Financing Activities is equal to net cash provided by operating activities less net cash used for investing activities.
(7) Adjusted EBITDA is provided solely as a supplemental disclosure with respect to liquidity because management believes it provides useful information regarding a company’s
ability to service its indebtedness. Adjusted EBITDA does not represent cash flow from operations, as defined by U.S. GAAP. You should not consider Adjusted EBITDA as a
substitute for net income or net loss, or as an indicator of our operating performance or whether cash flows will be sufficient to fund our cash needs. NACCO defines Adjusted
EBITDA as income before discontinued operations, Applica settlement and litigation charges, goodwill and other intangible assets impairment charges and income taxes plus
net interest expense and depreciation, depletion and amortization expense. Adjusted EBITDA is not a measurement under U.S. GAAP and is not necessarily comparable with
similarly titled measures of other companies. Net cash flows from operating, investing and financing activities as determined using U.S. GAAP are presented above. A reconciliation
of cash flow provided by operating activities to Adjusted EBITDA is presented below.
(8) Includes employees of Reed Minerals in 2012 and the unconsolidated mining subsidiaries for all years presented and excludes employees of Hyster-Yale and Red River for all
years presented.
$ 20.9
18.0
(6.4)
(2.6)
$ 29.9
$ (15.6)
(5.7)
(6.0)
(6.3)
$ (33.6)
$ 5.3
12.3
(12.4)
(8.9)
$ (3.7)
$ (70.1)
$ 53.1
3,800
$ 50.4
35.5
5.4
(41.8)
$ 49.5
$ (6.5)
(2.1)
(1.1)
(14.0)
$ (23.7)
$ 43.9
33.4
4.3
(55.8)
$ 25.8
$ (45.8)
$ 107.0
4,100
$ 25.9
15.0
6.3
(31.6)
$ 15.6
$ 6.9
(2.2)
(2.7)
0.7
$ (2.7)
$ 32.8
12.8
3.6
(30.9)
$ 18.3
$ (18.9)
$ 110.3
3,900
Year Ended December 31
2012(1) 2011(1)(2) 2010(1)(2) 2009(1)(2)(3) 2008(1)(2)(3)(4)
(In millions)
Reconciliation of net cash provided by operating
activities from continuing operations to EBITDA(7)
Net cash provided by operating activities
from continuing operations . . . . . . . . . . . . . . . . . . . . . . . . . .
Change in working capital items . . . . . . . . . . . . . . . . . . . . . . . .
Applica settlement and litigation costs . . . . . . . . . . . . . . . . . .
Gain on sale of assets and businesses. . . . . . . . . . . . . . . . . . .
Difference between deferred income
taxes and total tax provision (benefit) . . . . . . . . . . . . . . . . .
Other non-cash items . . . . . . . . . . . . . . . . . . . . . . . . . . . . . . . . . . .
Interest expense, net . . . . . . . . . . . . . . . . . . . . . . . . . . . . . . . . . . . .
Adjusted EBITDA(7) . . . . . . . . . . . . . . . . . . . . . . . . . . . . . . . . . . . . . . .
Calculation of Adjusted EBITDA(7)
Net income (loss) . . . . . . . . . . . . . . . . . . . . . . . . . . . . . . . . . . . . . . . .
Discontinued operations, net of tax . . . . . . . . . . . . . . . . . . . . .
Applica settlement and litigation costs . . . . . . . . . . . . . . . . . .
Goodwill and other intangible
assets impairment charges . . . . . . . . . . . . . . . . . . . . . . . . . . .
Income tax provision . . . . . . . . . . . . . . . . . . . . . . . . . . . . . . . . . . . .
Interest expense . . . . . . . . . . . . . . . . . . . . . . . . . . . . . . . . . . . . . . . .
Interest income . . . . . . . . . . . . . . . . . . . . . . . . . . . . . . . . . . . . . . . . .
Depreciation, depletion and amortization expense . . . . .
Adjusted EBITDA(7) . . . . . . . . . . . . . . . . . . . . . . . . . . . . . . . . . . . . . . .
$ 31.7
24.2
4.9
39.8
$ 100.6
$ (10.7)
(3.7)
(2.3)
(0.1)
$ (16.8)
$ 21.0
20.5
2.6
39.7
$ 83.8
$ (22.5)
$ 79.9
4,000
$ 100.6
1.6
(57.2)
1.0
32.9
(7.4)
8.4
$ 79.9
$ 162.1
(82.6)
(57.2)
—
32.8
8.7
(0.3)
16.4
$ 79.9
$ 29.9
14.2
0.8
—
1.6
(4.9)
11.5
$ 53.1
$ (437.6)
373.7
0.8
84.6
3.2
14.7
(3.2)
16.9
$ 53.1
$ 49.5
21.4
1.1
8.6
27.9
(14.3)
12.8
$ 107.0
$ 31.1
20.5
1.1
—
24.1
13.2
(0.4)
17.4
$ 107.0
$ 15.6
29.3
18.8
0.2
6.0
29.9
10.5
$ 110.3
$ 79.5
(32.4)
18.8
—
15.6
10.8
(0.3)
18.3
$ 110.3
$ 74.4
7.8
—
6.8
1.2
(14.2)
5.9
$ 81.9
$ 108.7
(66.5)
—
—
15.8
6.1
(0.2)
18.0
$ 81.9
Year Ended December 31
2012(1) 2011(1)(2) 2010(1)(2) 2009(1)(2)(3) 2008(1)(2)(3)(4)
(In millions, except employee data)
Cash Flow Data:
Operating Activities
North American Coal Corporation . . . . . . . . . . . . . . . . . . . .
Hamilton Beach Brands . . . . . . . . . . . . . . . . . . . . . . . . . . . . . . .
Kitchen Collection . . . . . . . . . . . . . . . . . . . . . . . . . . . . . . . . . . . .
NACCO and Other . . . . . . . . . . . . . . . . . . . . . . . . . . . . . . . . . . . .
Provided by operating activities from
continuing operations . . . . . . . . . . . . . . . . . . . . . . . . . . . . . . . .
Investing Activities
North American Coal Corporation . . . . . . . . . . . . . . . . . . . .
Hamilton Beach Brands . . . . . . . . . . . . . . . . . . . . . . . . . . . . . . .
Kitchen Collection . . . . . . . . . . . . . . . . . . . . . . . . . . . . . . . . . . . .
NACCO and Other . . . . . . . . . . . . . . . . . . . . . . . . . . . . . . . . . . . .
Provided by (used for) investing activities
from continuing operations . . . . . . . . . . . . . . . . . . . . . . . . . .
Cash Flow before Financing Activities(6)
North American Coal Corporation . . . . . . . . . . . . . . . . . . . .
Hamilton Beach Brands . . . . . . . . . . . . . . . . . . . . . . . . . . . . . . .
Kitchen Collection . . . . . . . . . . . . . . . . . . . . . . . . . . . . . . . . . . . .
NACCO and Other . . . . . . . . . . . . . . . . . . . . . . . . . . . . . . . . . . . .
Consolidated Cash Flow before Financing Activities
from continuing operations(6) . . . . . . . . . . . . . . . . . . . . . . . . . .
Used for financing activities from
continuing operations . . . . . . . . . . . . . . . . . . . . . . . . . . . . . . . .
Other Data:
Adjusted EBITDA(7) . . . . . . . . . . . . . . . . . . . . . . . . . . . . . . . . . . . . . .
Total employees at December 31(3)(8) . . . . . . . . . . . . . . . . . . . .
$ 50.2
27.4
3.8
(7.0)
$ 74.4
$ (56.3)
(3.2)
(3.9)
(0.3)
$ (63.7)
$ (6.1)
24.2
(0.1)
(7.3)
$ 10.7
$ (24.5)
$ 81.9
4,300