Graco 2005 Annual Report Download - page 2
Download and view the complete annual report
Please find page 2 of the 2005 Graco annual report below. You can navigate through the pages in the report by either clicking on the pages listed below, or by using the keyword search tool below to find specific information within the annual report.-
 1
1 -
 2
2 -
 3
3 -
 4
4 -
 5
5 -
 6
6 -
 7
7 -
 8
8 -
 9
9 -
 10
10 -
 11
11 -
 12
12 -
 13
13 -
14
-
15
-
16
-
17
-
18
-
19
-
20
-
21
-
22
-
23
-
24
-
25
-
26
-
27
-
28
-
29
-
30
-
31
-
32
-
33
-
34
-
35
-
36
-
37
-
38
-
39
-
40
-
41
-
42
-
43
-
44
-
45
-
46
-
47
-
48
-
49
-
50
-
51
-
52
-
53
-
54
-
55
-
56
-
57
-
58
-
59
-
60
-
61
-
62
-
63
-
64
-
65
-
66
-
67
-
68
-
69
-
70
-
71
-
72
-
73
-
74
-
75
-
76
-
77
-
78
-
79
-
80
-
81
 |
 |

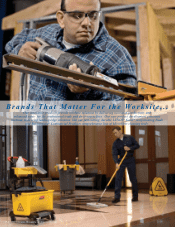
Newell Rubbermaid is a branded consumer and commercial
products company that touches the lives of people where they
work, live and play. Our brands matter to consumers by making
daily living more convenient and comfortable. Our brands matter
in the workplace by promoting higher productivity and increased
safety for people who use them every day. Long-term success
requires partnering with and supporting our customers and
developing our employees.
Our priority is to increase value for shareholders. We will succeed
through our commitment to increasing investment in new product
development and brand building, continuously improving our
cost structure, and strengthening our portfolio. We are are excited
about the opportunities that lie ahead and are well-positioned for
future growth.
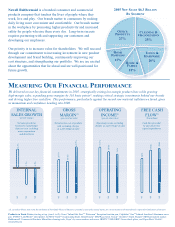
MEASURING OUR FINANCIAL PERFORMANCE
INTERNAL
SALES GROWTH
(percent change)
GROSS
MARGIN(1)
(percent of net sales)
OPERATING
INCOME(2)
(percent of net sales)
We delivered on our key financial commitments in 2005, strategically exiting low-margin product lines while growing
high-margin sales, expanding gross margins by 130 basis points(1), making critical strategic investments behind our brands
and driving higher free cash flow. This performance, particularly against the record raw material inflation we faced, gives
us momentum and confidence heading into 2006.
2005 NET SALES $6.3 BILLION
BYSEGMENT
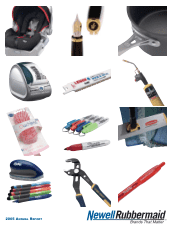
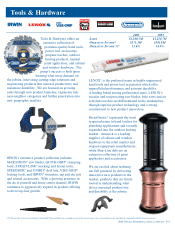
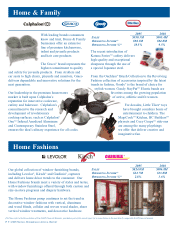
Products on Front Cover (starting at top, from L to R): Graco®Infant Safe SeatTM, Waterman®Exception fountain pen, Calphalon®OneTM Infused Anodized Aluminum sauce
pan, DYMO®LabelWriter®label printer, LENOX®GoldTM reciprocating blade, BernzOmatic®MAPP gas torch, Goody®Ouchless®brush, Sharpie®MINI permanent marker,
Rubbermaid®Commercial Products Microfiber cleaning tools, Expo®dry erase markers and eraser, IRWIN®VISE-GRIP®GrooveLock pliers, and Paper Mate®Profile®
retractable pen
28.7%
28.6%
'04
'03
9.6%
10.0%
11.1%
'05 29.9%
'04
'03
'05
-2.5%
-1.7%
2.1%
'04
'03
'05
CLEANING &
ORGANIZATION
25%
TOOLS &
HARDWARE
20%
HOME &
FAMILY
15%
HOME
FASHIONS
13%
OFFICE
PRODUCTS
27%
FREE CASH
FLOW(3)
($ in millions)
$550
$538
$473
'04
'03
'05
Net sales growth for
businesses owned longer
than one year, including
minor acquisitions
and divestitures
Net sales less cost of products
sold, excluding charges,
as a percentage of sales
Operating income, excluding
charges, as a percentage of sales
Cash flow provided
by operations less
capital expenditures
(1), (2) and (3) Please refer to the Reconciliation of Non-GAAP Financial Measures, provided as part of this annual report, for a reconciliation to the most directly comparable GAAP financial measure.