Graco 2005 Annual Report Download - page 19
Download and view the complete annual report
Please find page 19 of the 2005 Graco annual report below. You can navigate through the pages in the report by either clicking on the pages listed below, or by using the keyword search tool below to find specific information within the annual report.-
 1
1 -
2
-
3
-
4
-
5
-
6
-
7
-
8
-
 9
9 -
 10
10 -
 11
11 -
 12
12 -
 13
13 -
 14
14 -
 15
15 -
 16
16 -
 17
17 -
 18
18 -
 19
19 -
 20
20 -
 21
21 -
 22
22 -
 23
23 -
 24
24 -
 25
25 -
 26
26 -
 27
27 -
 28
28 -
 29
29 -
30
-
31
-
32
-
33
-
34
-
35
-
36
-
37
-
38
-
39
-
40
-
41
-
42
-
43
-
44
-
45
-
46
-
47
-
48
-
49
-
50
-
51
-
52
-
53
-
54
-
55
-
56
-
57
-
58
-
59
-
60
-
61
-
62
-
63
-
64
-
65
-
66
-
67
-
68
-
69
-
70
-
71
-
72
-
73
-
74
-
75
-
76
-
77
-
78
-
79
-
80
-
81
 |
 |

Business Segment Operating Results
2005 vs. 2004 Business Segment Operating Results
Net sales by segment were as follows for the year ended December 31, (in millions, except
percentages):
2005 2004 % Change
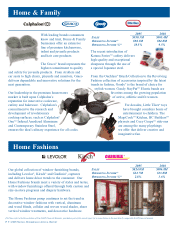
Cleaning & OrganizationÏÏÏÏÏÏÏÏÏÏÏÏÏÏÏÏÏÏÏÏÏÏÏÏÏÏÏÏÏÏÏÏÏ $1,614.6 $1,702.7 (5.2)%
OÇce Products ÏÏÏÏÏÏÏÏÏÏÏÏÏÏÏÏÏÏÏÏÏÏÏÏÏÏÏÏÏÏÏÏÏÏÏÏÏÏÏÏÏ 1,713.3 1,686.2 1.6
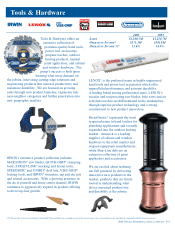
Tools & Hardware ÏÏÏÏÏÏÏÏÏÏÏÏÏÏÏÏÏÏÏÏÏÏÏÏÏÏÏÏÏÏÏÏÏÏÏÏÏÏ 1,260.3 1,218.7 3.4
Home FashionsÏÏÏÏÏÏÏÏÏÏÏÏÏÏÏÏÏÏÏÏÏÏÏÏÏÏÏÏÏÏÏÏÏÏÏÏÏÏÏÏÏ 824.0 906.8 (9.1)
Other ÏÏÏÏÏÏÏÏÏÏÏÏÏÏÏÏÏÏÏÏÏÏÏÏÏÏÏÏÏÏÏÏÏÏÏÏÏÏÏÏÏÏÏÏÏÏÏÏÏ 930.3 965.4 (3.6)
Total Net Sales ÏÏÏÏÏÏÏÏÏÏÏÏÏÏÏÏÏÏÏÏÏÏÏÏÏÏÏÏÏÏÏÏÏÏÏÏÏÏ $6,342.5 $6,479.8 (2.1)%
Operating income by segment was as follows for the year ended December 31, (in millions, except
percentages):
2005 2004 % Change
Cleaning & OrganizationÏÏÏÏÏÏÏÏÏÏÏÏÏÏÏÏÏÏÏÏÏÏÏÏÏÏÏÏÏÏÏÏÏÏÏÏ $116.9 $100.7 16.1%
OÇce Products ÏÏÏÏÏÏÏÏÏÏÏÏÏÏÏÏÏÏÏÏÏÏÏÏÏÏÏÏÏÏÏÏÏÏÏÏÏÏÏÏÏÏÏÏ 266.0 261.9 1.6
Tools & Hardware ÏÏÏÏÏÏÏÏÏÏÏÏÏÏÏÏÏÏÏÏÏÏÏÏÏÏÏÏÏÏÏÏÏÏÏÏÏÏÏÏÏ 171.1 181.8 (5.9)
Home FashionsÏÏÏÏÏÏÏÏÏÏÏÏÏÏÏÏÏÏÏÏÏÏÏÏÏÏÏÏÏÏÏÏÏÏÏÏÏÏÏÏÏÏÏÏ 22.7 33.0 (31.2)
Other ÏÏÏÏÏÏÏÏÏÏÏÏÏÏÏÏÏÏÏÏÏÏÏÏÏÏÏÏÏÏÏÏÏÏÏÏÏÏÏÏÏÏÏÏÏÏÏÏÏÏÏÏ 98.1 92.0 6.6
Corporate ÏÏÏÏÏÏÏÏÏÏÏÏÏÏÏÏÏÏÏÏÏÏÏÏÏÏÏÏÏÏÏÏÏÏÏÏÏÏÏÏÏÏÏÏÏÏÏÏ (46.0) (39.4) (16.8)
Impairment chargeÏÏÏÏÏÏÏÏÏÏÏÏÏÏÏÏÏÏÏÏÏÏÏÏÏÏÏÏÏÏÏÏÏÏÏÏÏÏÏÏÏ (34.4) (295.1)
Restructuring costsÏÏÏÏÏÏÏÏÏÏÏÏÏÏÏÏÏÏÏÏÏÏÏÏÏÏÏÏÏÏÏÏÏÏÏÏÏÏÏÏÏ (72.2) (44.2)
Total Operating Income ÏÏÏÏÏÏÏÏÏÏÏÏÏÏÏÏÏÏÏÏÏÏÏÏÏÏÏÏÏÏÏÏÏÏ $522.2 $290.7 79.6%
Cleaning & Organization
Net sales for 2005 were $1,614.6 million, a decrease of $88.1 million, or 5.2%, from $1,702.7 million
in 2004, driven primarily by the planned product line exits and core sales declines in the Rubbermaid
Home Products business. These factors were partially oÅset by increases in core product sales in the
Rubbermaid Commercial Products business, favorable pricing and foreign currency translation.
Operating income for 2005 was $116.9 million, an increase of $16.2 million, or 16.1%, from
$100.7 million in 2004. The improvement in operating income is the result of core sales growth in
Rubbermaid Commercial Products, favorable sales mix and favorable pricing which more than oÅset raw
material inÖation and lost absorption in manufacturing facilities.
OÇce Products
Net sales for 2005 were $1,713.3 million, an increase of $27.1 million, or 1.6% from $1,686.2 million
in 2004. The increase was primarily due to the acquisition of DYMO, the introduction of innovative new
products in the markers business and favorable foreign currency translation, partially oÅset by sales
declines in the Ñne writing and the Eldon oÇce products businesses.
Operating income for 2005 was $266.0 million, an increase of $4.1 million, or 1.6%, from
$261.9 million in 2004, as a result of the impact of the DYMO acquisition and improved margins
associated with the new product introductions and productivity, partially oÅset by raw material inÖation
and increased investment in SG&A, primarily related to advertising and promotion.
18