Garmin 2011 Annual Report Download - page 18
Download and view the complete annual report
Please find page 18 of the 2011 Garmin annual report below. You can navigate through the pages in the report by either clicking on the pages listed below, or by using the keyword search tool below to find specific information within the annual report.-
 1
1 -
2
-
3
-
4
-
5
-
6
-
7
-
 8
8 -
 9
9 -
 10
10 -
 11
11 -
 12
12 -
 13
13 -
 14
14 -
 15
15 -
 16
16 -
 17
17 -
 18
18 -
 19
19 -
 20
20
 |
 |

Financial review
*$100 invested on 12/31/06
in stock or index, including
reinvestment of dividends. Fiscal
year ending December 31.
The stock price performance
included in this graph is not
necessarily indicative of future
stock price performance.
This graph matches Garmin
Ltd.’s cumulative 5-year
total shareholder return
on common stock with the
cumulative total returns of
the NASDAQ Composite Index
and the NASDAQ 100 Index.
The graph assumes that the
value of the investment in
our common stock and in
each of the indexes (including
reinvestment of dividends)
was $100 on 12/31/2006 and
tracks it through 12/31/2011.
$200
$180
$160
$140
$120
$100
$80
$60
$40
$20
$0
12/06 12/07 12/08 12/09 12/10 12/11
100.00 175.58 36.23 59.42 62.45 84.07
100.00 110.26 65.65 95.19 112.10 110.81
100.00 119.21 72.02 109.80 126.56 130.99
Garmin Ltd.
NASDAQ Composite
NASDAQ 100
Comparison of 5-year cumulative total return*
Among Garmin Ltd., the NASDAQ Composite Index, and the NASDAQ 100 Index
The selected financial data below and elsewhere in this annual report should be read in conjunction with the consolidated financial statements and notes
thereto included in our Annual Report on Form 10-K, a copy of which is included with this annual report or is available at Garmin.com/financials.
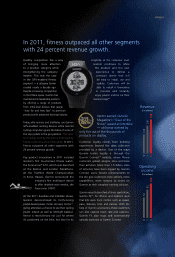
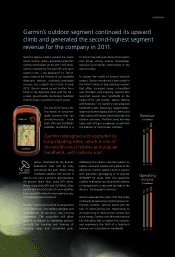
Automotive/Mobile
Outdoor
Fitness
Aviation
Marine
Revenue by segment
(% of total)
2011
8
10
11
13 58
2010
7
10
9
12 62
Operating income by segment
(% of total)
2011
10
13
19 29
29
2010
11
11
14
25
39
3,180
3,494
07 08 09 10 11
2,946
2,690
2,759
Revenue and
net income
($ in millions)
159
206
07 08 09 10 11
238
277
299
R&D
expenditures
($ in millions)
3.89
3.48
07 08 09 10 11
3.50
2.95
2.67
Diluted EPS
($ per share)
521
585
704
855
10.69
10.57
07 08 09 10 11
14.10
15.40
16.71
Book value
per share
($ per share)
733
2009
6
8
6
10
70
2009
7
7
8
19 59