Ford 2011 Annual Report Download - page 7
Download and view the complete annual report
Please find page 7 of the 2011 Ford annual report below. You can navigate through the pages in the report by either clicking on the pages listed below, or by using the keyword search tool below to find specific information within the annual report.-
 1
1 -
 2
2 -
 3
3 -
 4
4 -
 5
5 -
 6
6 -
 7
7 -
 8
8 -
 9
9 -
 10
10 -
 11
11 -
 12
12 -
 13
13 -
 14
14 -
 15
15 -
 16
16 -
 17
17 -
 18
18 -
19
-
20
-
21
-
22
-
23
-
24
-
25
-
26
-
27
-
28
-
29
-
30
-
31
-
32
-
33
-
34
-
35
-
36
-
37
-
38
-
39
-
40
-
41
-
42
-
43
-
44
-
45
-
46
-
47
-
48
-
49
-
50
-
51
-
52
-
53
-
54
-
55
-
56
-
57
-
58
-
59
-
60
-
61
-
62
-
63
-
64
-
65
-
66
-
67
-
68
-
69
-
70
-
71
-
72
-
73
-
74
-
75
-
76
-
77
-
78
-
79
-
80
-
81
-
82
-
83
-
84
-
85
-
86
-
87
-
88
-
89
-
90
-
91
-
92
-
93
-
94
-
95
-
96
-
97
-
98
-
99
-
100
-
101
-
102
-
103
-
104
-
105
-
106
-
107
-
108
-
109
-
110
-
111
-
112
-
113
-
114
-
115
-
116
-
117
-
118
-
119
-
120
-
121
-
122
-
123
-
124
-
125
-
126
-
127
-
128
-
129
-
130
-
131
-
132
-
133
-
134
-
135
-
136
-
137
-
138
-
139
-
140
-
141
-
142
-
143
-
144
-
145
-
146
-
147
-
148
-
149
-
150
-
151
-
152
-
153
-
154
-
155
-
156
-
157
-
158
-
159
-
160
-
161
-
162
-
163
-
164
-
165
-
166
-
167
-
168
-
169
-
170
-
171
-
172
-
173
-
174
-
175
-
176
-
177
-
178
-
179
-
180
-
181
-
182
-
183
-
184
-
185
-
186
-
187
-
188
 |
 |

Ford Motor Company | 2011 Annual Report 5
Environmental and social goals are key elements of our
business strategy, and our business objectives are fully
aligned with our efforts to help build a better world.
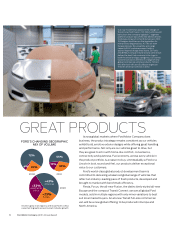
A good example of this is our commitment to being a
leader in fuel economy. In a 2011 survey of consumers,
42 percent said fuel economy is an “extremely important”
new vehicle purchase consideration, which is up over
13 percent versus a decade ago. To meet this growing
need, nearly one-third of Ford’s U.S. vehicle lines will
feature a model with 40 mpg or more in 2012 – a claim
no other full-line automaker can match.
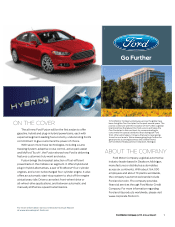
We also are strongly committed to growing our family of
electrified vehicles. By next year, we will triple our production
capacity for electrified vehicles in North America. Our
approach is to offer our customers a variety of choices to
meet their different needs.
We now offer in the U.S. the battery-powered Focus Electric
sedan and the Ford Fusion Hybrid. By the end of the year
we will introduce the C-MAX Hybrid, C-MAX Energi plug-in
hybrid, and Fusion Energi plug-in hybrid.
We recently added our new 1.0-liter EcoBoost three-cylinder
– the smallest engine Ford has ever built – and will offer in
the future an all-new eight-speed automatic transmission.
We are building these products in factories that are lean and
clean. Between 2000 and 2010, we cut energy use at our
global facilities by 40 percent, CO2 emissions by 49 percent
and water use by 62 percent. A number of our facilities use
power from solar panels, hydro-electricity, geothermal, and
wind. We are replicating many sustainable technologies first
piloted at the Rouge Center.
Serving our communities also is an important part of
contributing to a better world. In 2011 Ford Motor Company
Fund and Community Services continued its support of
non-profit organizations in three major areas: innovation and
education, community development and American legacy,
and auto-related safety education. Ford employees around
the world also helped out in their communities through our
Ford Volunteer Corps.
Last year 25,000 Ford employee volunteers contributed
110,000 volunteer hours working on 1,200 community
projects. Those totals include our annual Global Week of
Caring, which involved 12,000 Ford employee volunteers,
244 projects and 55,000 volunteer hours on six continents.
Looking Ahead**
For 2012 we remain focused on continuing to deliver the key
aspects of our One Ford plan, which are unchanged:
• Aggressively restructure to operate profitably at the current
demand and changing model mix.
• Accelerate the development of new products that
customers want and value.
• Finance the plan and improve the balance sheet.
• Work together effectively as one team, leveraging our
global assets.
We expect to continue improving our business and deliver
improved Automotive pre-tax operating profits, strong
operating-related cash flow, and solid Ford Credit profits.
Overall, the Company’s pre-tax operating profits, excluding
special items, should be about equal to 2011’s strong level.
We expect full year U.S. industry sales to be in the range of
13.5 million to 14.5 million vehicles. Full year industry sales
in Europe, in the 19 markets we track, should be at the low
end of the range of 14 million to 15 million. Overall, we expect
global industry sales to be about 80 million vehicles, up
about 5 percent from 2011. We expect our full year market
share in the U.S. and Europe to be about equal to 2011.
The rapid pace of our new product introductions around
the world will continue in 2012, as will the expansion of our
production facilities in global growth markets such as China,
India and Russia. We also expect to deliver year-over-year
improvements in the quality of our vehicles worldwide.
We recognize we have challenges ahead of us, but there
are great opportunities as well. We are excited about
accelerating the realization of the full potential of the
global scale and operating margin benefits of our One Ford
plan. We also are excited about what leveraging our global
assets ultimately will deliver: profitable growth for everyone
associated with our business.
As always, we thank you for your support of our efforts.
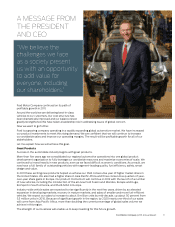
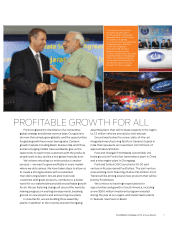
Alan R. Mulally
President and Chief Executive Officer
March 14, 2012
“We made substantial
investments in our future
in 2011, but it also was
a milestone year in our
efforts to strengthen
our balance sheet.”
* Profi t amounts exclude Special Items, which are detailed on pages 35-36 of this report
** See Risk Factors on page 71 of this report