Fannie Mae 2010 Annual Report Download - page 13
Download and view the complete annual report
Please find page 13 of the 2010 Fannie Mae annual report below. You can navigate through the pages in the report by either clicking on the pages listed below, or by using the keyword search tool below to find specific information within the annual report.-
 1
1 -
2
-
 3
3 -
 4
4 -
 5
5 -
 6
6 -
 7
7 -
 8
8 -
 9
9 -
 10
10 -
 11
11 -
 12
12 -
 13
13 -
 14
14 -
 15
15 -
 16
16 -
 17
17 -
 18
18 -
 19
19 -
 20
20 -
 21
21 -
 22
22 -
 23
23 -
24
-
25
-
26
-
27
-
28
-
29
-
30
-
31
-
32
-
33
-
34
-
35
-
36
-
37
-
38
-
39
-
40
-
41
-
42
-
43
-
44
-
45
-
46
-
47
-
48
-
49
-
50
-
51
-
52
-
53
-
54
-
55
-
56
-
57
-
58
-
59
-
60
-
61
-
62
-
63
-
64
-
65
-
66
-
67
-
68
-
69
-
70
-
71
-
72
-
73
-
74
-
75
-
76
-
77
-
78
-
79
-
80
-
81
-
82
-
83
-
84
-
85
-
86
-
87
-
88
-
89
-
90
-
91
-
92
-
93
-
94
-
95
-
96
-
97
-
98
-
99
-
100
-
101
-
102
-
103
-
104
-
105
-
106
-
107
-
108
-
109
-
110
-
111
-
112
-
113
-
114
-
115
-
116
-
117
-
118
-
119
-
120
-
121
-
122
-
123
-
124
-
125
-
126
-
127
-
128
-
129
-
130
-
131
-
132
-
133
-
134
-
135
-
136
-
137
-
138
-
139
-
140
-
141
-
142
-
143
-
144
-
145
-
146
-
147
-
148
-
149
-
150
-
151
-
152
-
153
-
154
-
155
-
156
-
157
-
158
-
159
-
160
-
161
-
162
-
163
-
164
-
165
-
166
-
167
-
168
-
169
-
170
-
171
-
172
-
173
-
174
-
175
-
176
-
177
-
178
-
179
-
180
-
181
-
182
-
183
-
184
-
185
-
186
-
187
-
188
-
189
-
190
-
191
-
192
-
193
-
194
-
195
-
196
-
197
-
198
-
199
-
200
-
201
-
202
-
203
-
204
-
205
-
206
-
207
-
208
-
209
-
210
-
211
-
212
-
213
-
214
-
215
-
216
-
217
-
218
-
219
-
220
-
221
-
222
-
223
-
224
-
225
-
226
-
227
-
228
-
229
-
230
-
231
-
232
-
233
-
234
-
235
-
236
-
237
-
238
-
239
-
240
-
241
-
242
-
243
-
244
-
245
-
246
-
247
-
248
-
249
-
250
-
251
-
252
-
253
-
254
-
255
-
256
-
257
-
258
-
259
-
260
-
261
-
262
-
263
-
264
-
265
-
266
-
267
-
268
-
269
-
270
-
271
-
272
-
273
-
274
-
275
-
276
-
277
-
278
-
279
-
280
-
281
-
282
-
283
-
284
-
285
-
286
-
287
-
288
-
289
-
290
-
291
-
292
-
293
-
294
-
295
-
296
-
297
-
298
-
299
-
300
-
301
-
302
-
303
-
304
-
305
-
306
-
307
-
308
-
309
-
310
-
311
-
312
-
313
-
314
-
315
-
316
-
317
-
318
-
319
-
320
-
321
-
322
-
323
-
324
-
325
-
326
-
327
-
328
-
329
-
330
-
331
-
332
-
333
-
334
-
335
-
336
-
337
-
338
-
339
-
340
-
341
-
342
-
343
-
344
-
345
-
346
-
347
-
348
-
349
-
350
-
351
-
352
-
353
-
354
-
355
-
356
-
357
-
358
-
359
-
360
-
361
-
362
-
363
-
364
-
365
-
366
-
367
-
368
-
369
-
370
-
371
-
372
-
373
-
374
-
375
-
376
-
377
-
378
-
379
-
380
-
381
-
382
-
383
-
384
-
385
-
386
-
387
-
388
-
389
-
390
-
391
-
392
-
393
-
394
-
395
-
396
-
397
-
398
-
399
-
400
-
401
-
402
-
403
 |
 |
unrealized losses in our holdings of available-for-sale securities. Our net worth, which is the basis for
determining the amount that Treasury has committed to provide us under the senior preferred stock purchase
agreement, equals the “Total deficit” reported in our consolidated balance sheets. In February 2011, the Acting
Director of FHFA submitted a request to Treasury on our behalf for $2.6 billion to eliminate our net worth
deficit as of December 31, 2010. When Treasury provides the requested funds, the aggregate liquidation
preference on the senior preferred stock will be $91.2 billion, which will require an annualized dividend
payment of $9.1 billion. This amount exceeds our reported annual net income for each of the last nine years,
in most cases by a significant margin. Through December 31, 2010, we have paid an aggregate of
$10.2 billion to Treasury in dividends on the senior preferred stock.
Our total loss reserves, which reflect our estimate of the probable losses we have incurred in our guaranty
book of business, increased to $66.3 billion as of December 31, 2010 from $64.7 billion as of September 30,
2010, $61.4 billion as of January 1, 2010 and $64.9 billion as of December 31, 2009. Our total loss reserve
coverage to total nonperforming loans was 30.85% as of December 31, 2010, compared with 30.34% as of
September 30, 2010 and 29.98% as of December 31, 2009.
We recognized net income of $73 million for the fourth quarter of 2010, driven primarily by net interest
income of $4.6 billion and fair value gains of $366 million, which were partially offset by credit-related
expenses of $4.3 billion and administrative expenses of $592 million. Our fourth quarter results were
favorably impacted by the cash payment received from Bank of America, because it reduced our credit-related
expenses for the period. The net loss attributable to common stockholders, which includes $2.2 billion in
dividends on senior preferred stock, was $2.1 billion and our diluted loss per share was $0.37. In comparison,
we recognized a net loss of $1.3 billion, a net loss attributable to common stockholders of $3.5 billion and a
diluted loss per share of $0.61 for the third quarter of 2010. We recognized a net loss of $15.2 billion, a net
loss attributable to common stockholders of $16.3 billion and a diluted loss per share of $2.87 for the fourth
quarter of 2009.
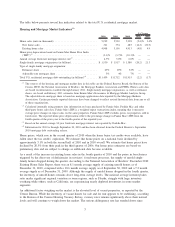
Providing Mortgage Market Liquidity
We support liquidity and stability in the secondary mortgage market, serving as a stable source of funds for
purchases of homes and multifamily rental housing and for refinancing existing mortgages. We provide this
financing through the activities of our three complementary businesses: our Single-Family business (“Single-
Family”), our Multifamily Mortgage Business (“Multifamily,” formerly “Housing and Community
Development,” or “HCD”) and our Capital Markets group. Our Single-Family and Multifamily businesses
work with our lender customers to purchase and securitize mortgage loans customers deliver to us into Fannie
Mae MBS. Our Capital Markets group manages our investment activity in mortgage-related assets, funding
investments primarily through proceeds we receive from the issuance of debt securities in the domestic and
international capital markets. The Capital Markets group works with lender customers to provide funds to the
mortgage market through short-term financing and other activities, making short-term use of our balance sheet.
These financing activities include whole loan conduit transactions, early funding transactions, Real Estate
Mortgage Investment Conduit (“REMIC”) and other structured securitization activities, and dollar rolls, which
we describe in more detail in “Business Segments — Capital Markets Group.”
In 2010, we purchased or guaranteed approximately $856 billion in loans, measured by unpaid principal
balance, which includes approximately $217 billion in delinquent loans we purchased from our single-family
MBS trusts. Our purchases and guarantees financed approximately 2,712,000 single-family conventional loans,
excluding delinquent loans purchased from our MBS trusts, and approximately 306,000 units in multifamily
properties.
Our mortgage credit book of business — which consists of the mortgage loans and mortgage-related securities
we hold in our investment portfolio, Fannie Mae MBS held by third parties and other credit enhancements that
we provide on mortgage assets — totaled $3.1 trillion as of September 30, 2010, which represented
approximately 27.4% of U.S. residential mortgage debt outstanding on September 30, 2010, the latest date for
which the Federal Reserve has estimated U.S. residential mortgage debt outstanding. We remained the largest
single issuer of mortgage-related securities in the secondary market, with an estimated market share of new
8