Fannie Mae 2010 Annual Report Download - page 12
Download and view the complete annual report
Please find page 12 of the 2010 Fannie Mae annual report below. You can navigate through the pages in the report by either clicking on the pages listed below, or by using the keyword search tool below to find specific information within the annual report.-
 1
1 -
 2
2 -
 3
3 -
 4
4 -
 5
5 -
 6
6 -
 7
7 -
 8
8 -
 9
9 -
 10
10 -
 11
11 -
 12
12 -
 13
13 -
 14
14 -
 15
15 -
 16
16 -
 17
17 -
 18
18 -
 19
19 -
 20
20 -
 21
21 -
 22
22 -
23
-
24
-
25
-
26
-
27
-
28
-
29
-
30
-
31
-
32
-
33
-
34
-
35
-
36
-
37
-
38
-
39
-
40
-
41
-
42
-
43
-
44
-
45
-
46
-
47
-
48
-
49
-
50
-
51
-
52
-
53
-
54
-
55
-
56
-
57
-
58
-
59
-
60
-
61
-
62
-
63
-
64
-
65
-
66
-
67
-
68
-
69
-
70
-
71
-
72
-
73
-
74
-
75
-
76
-
77
-
78
-
79
-
80
-
81
-
82
-
83
-
84
-
85
-
86
-
87
-
88
-
89
-
90
-
91
-
92
-
93
-
94
-
95
-
96
-
97
-
98
-
99
-
100
-
101
-
102
-
103
-
104
-
105
-
106
-
107
-
108
-
109
-
110
-
111
-
112
-
113
-
114
-
115
-
116
-
117
-
118
-
119
-
120
-
121
-
122
-
123
-
124
-
125
-
126
-
127
-
128
-
129
-
130
-
131
-
132
-
133
-
134
-
135
-
136
-
137
-
138
-
139
-
140
-
141
-
142
-
143
-
144
-
145
-
146
-
147
-
148
-
149
-
150
-
151
-
152
-
153
-
154
-
155
-
156
-
157
-
158
-
159
-
160
-
161
-
162
-
163
-
164
-
165
-
166
-
167
-
168
-
169
-
170
-
171
-
172
-
173
-
174
-
175
-
176
-
177
-
178
-
179
-
180
-
181
-
182
-
183
-
184
-
185
-
186
-
187
-
188
-
189
-
190
-
191
-
192
-
193
-
194
-
195
-
196
-
197
-
198
-
199
-
200
-
201
-
202
-
203
-
204
-
205
-
206
-
207
-
208
-
209
-
210
-
211
-
212
-
213
-
214
-
215
-
216
-
217
-
218
-
219
-
220
-
221
-
222
-
223
-
224
-
225
-
226
-
227
-
228
-
229
-
230
-
231
-
232
-
233
-
234
-
235
-
236
-
237
-
238
-
239
-
240
-
241
-
242
-
243
-
244
-
245
-
246
-
247
-
248
-
249
-
250
-
251
-
252
-
253
-
254
-
255
-
256
-
257
-
258
-
259
-
260
-
261
-
262
-
263
-
264
-
265
-
266
-
267
-
268
-
269
-
270
-
271
-
272
-
273
-
274
-
275
-
276
-
277
-
278
-
279
-
280
-
281
-
282
-
283
-
284
-
285
-
286
-
287
-
288
-
289
-
290
-
291
-
292
-
293
-
294
-
295
-
296
-
297
-
298
-
299
-
300
-
301
-
302
-
303
-
304
-
305
-
306
-
307
-
308
-
309
-
310
-
311
-
312
-
313
-
314
-
315
-
316
-
317
-
318
-
319
-
320
-
321
-
322
-
323
-
324
-
325
-
326
-
327
-
328
-
329
-
330
-
331
-
332
-
333
-
334
-
335
-
336
-
337
-
338
-
339
-
340
-
341
-
342
-
343
-
344
-
345
-
346
-
347
-
348
-
349
-
350
-
351
-
352
-
353
-
354
-
355
-
356
-
357
-
358
-
359
-
360
-
361
-
362
-
363
-
364
-
365
-
366
-
367
-
368
-
369
-
370
-
371
-
372
-
373
-
374
-
375
-
376
-
377
-
378
-
379
-
380
-
381
-
382
-
383
-
384
-
385
-
386
-
387
-
388
-
389
-
390
-
391
-
392
-
393
-
394
-
395
-
396
-
397
-
398
-
399
-
400
-
401
-
402
-
403
 |
 |
bonds issued by the trusts in the form of Fannie Mae MBS certificates) of these trusts as assets and liabilities
in our consolidated balance sheets.
Although the new accounting standards did not change the economic risk to our business, we recorded a
decrease of $3.3 billion in our total deficit as of January 1, 2010 to reflect the cumulative effect of adopting
these new standards. We provide a detailed discussion of the impact of the new accounting standards on our
accounting and financial statements in “Note 2, Adoption of the New Accounting Standards on the Transfers
of Financial Assets and Consolidation of Variable Interest Entities.” Upon adopting the new accounting
standards, we changed the presentation of segment financial information that is currently evaluated by
management, as we discuss in “Business Segment Results — Changes to Segment Reporting.”
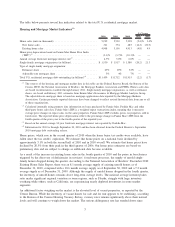
We recognized a net loss of $14.0 billion for 2010, a net loss attributable to common stockholders of
$21.7 billion, which includes $7.7 billion in dividends on senior preferred stock paid to Treasury, and a diluted
loss per share of $3.81. In comparison, we recognized a net loss of $72.0 billion, a net loss attributable to
common stockholders of $74.4 billion, including $2.5 billion in dividends on senior preferred stock, and a
diluted loss per share of $13.11 in 2009.
The $58.0 billion decrease in our net loss for 2010 compared with 2009 was due primarily to:
• a $46.9 billion decrease in credit-related expenses, which consist of the provision for loan losses, the
provision for guaranty losses (collectively referred to as the “provision for credit losses”) plus foreclosed
property expense, due to the factors described below;
• a $9.1 billion decrease in net other-than-temporary impairments due to slower deterioration of the
estimated credit component of the fair value losses of Alt-A and subprime securities. In addition, net-
other-than temporary impairment decreased in 2010 compared with 2009 because, effective beginning in
the second quarter of 2009,we recognize only the credit portion of other-than-temporary impairment in
our consolidated statements of operations due to the adoption of a new other-than-temporary impairment
accounting standard;
• a $6.7 billion decrease in losses from partnership investments resulting primarily from the recognition, in
the fourth quarter of 2009, of $5.0 billion in other-than-temporary impairment losses on our federal low-
income housing tax credit (“LIHTC”) investments; and
• a $2.3 billion decrease in net fair value losses primarily due to lower fair value losses on risk
management derivatives.
Our credit-related expenses were $26.6 billion for 2010 compared with $73.5 billion for 2009. Our provision
for credit losses was substantially lower in 2010, primarily because there was neither a significant increase in
the number of seriously delinquent loans, nor a sharp decline in home prices. Therefore, we did not need to
substantially increase our total loss reserves in 2010. Another contributing factor was the insignificant amount
of fair value losses on acquired credit-impaired loans recognized in 2010, because only purchases of credit-
deteriorated loans from unconsolidated MBS trusts or as a result of other credit guarantees generate fair value
losses upon acquisition, due to our adoption of the new accounting standards. Additionally, on December 31,
2010, we entered into an agreement with Bank of America, N.A., and its affiliates, to address outstanding
repurchase requests for residential mortgage loans. Bank of America agreed, among other things, to a cash
payment of $1.3 billion, $930 million of which was recognized as a recovery of charge-offs, resulting in a
reduction to our provision for loan losses and allowance for loan losses, and $266 million as a reduction to
foreclosed property expense. For additional information on the terms of this agreement, see “Risk
Management — Credit Risk Management — Institutional Counterparty Credit Risk Management.”
We had a net worth deficit of $2.5 billion as of December 31, 2010 and $2.4 billion as of September 30, 2010,
compared with $15.3 billion as of December 31, 2009. Our net worth as of December 31, 2010 was negatively
impacted by the recognition of our net loss of $14.0 billion and the senior preferred stock dividends of
$7.7 billion. These reductions in our net worth were offset by our receipt of $27.7 billion in funds from
Treasury under our senior preferred stock purchase agreement with Treasury, a $3.3 billion cumulative effect
from the adoption of new accounting standards as of January 1, 2010, and a $3.1 billion reduction in
7