Family Dollar 2005 Annual Report Download - page 16
Download and view the complete annual report
Please find page 16 of the 2005 Family Dollar annual report below. You can navigate through the pages in the report by either clicking on the pages listed below, or by using the keyword search tool below to find specific information within the annual report.-
 1
1 -
2
-
3
-
4
-
5
-
 6
6 -
 7
7 -
 8
8 -
 9
9 -
 10
10 -
 11
11 -
 12
12 -
 13
13 -
 14
14 -
 15
15 -
 16
16 -
 17
17 -
 18
18 -
 19
19 -
 20
20
 |
 |
Family Dollar Stores, Inc.
value
14
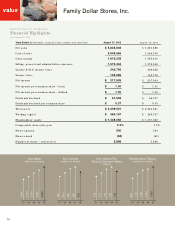
Years Ended (In thousands, except per share amounts and store data) August 27, 2005 August 28, 2004
Net sales $ 5,824,808 $ 5,281,888
Cost o f sales 3,908,569 3,496,278
Gross margin 1,916,239 1,785,610
Selling, general and administrative expenses 1,573,444 1,378,948
Inco me before inco me taxes 342,795 406,662
Inco me taxes 125,286 148,758
Net income $ 217,509 $ 257,904
Net income per commo n share – basic $ 1.30 $ 1.51
Net income per commo n share – diluted $ 1.30 $ 1.50
Dividends declared $ 61,538 $ 56,077
Dividends declared per co mmon share $ 0.37 $ 0.33
Total assets $ 2,409,501 $ 2,224,361
Working capital $ 460,157 $ 489,727
Shareho lders’ equity $ 1,428,066 $ 1,337,082
Comparable store sales gain 2.3% 1.9%
Stores opened 500 500
Stores closed (68) (61)
Number of stores – end of year 5,898 5,466
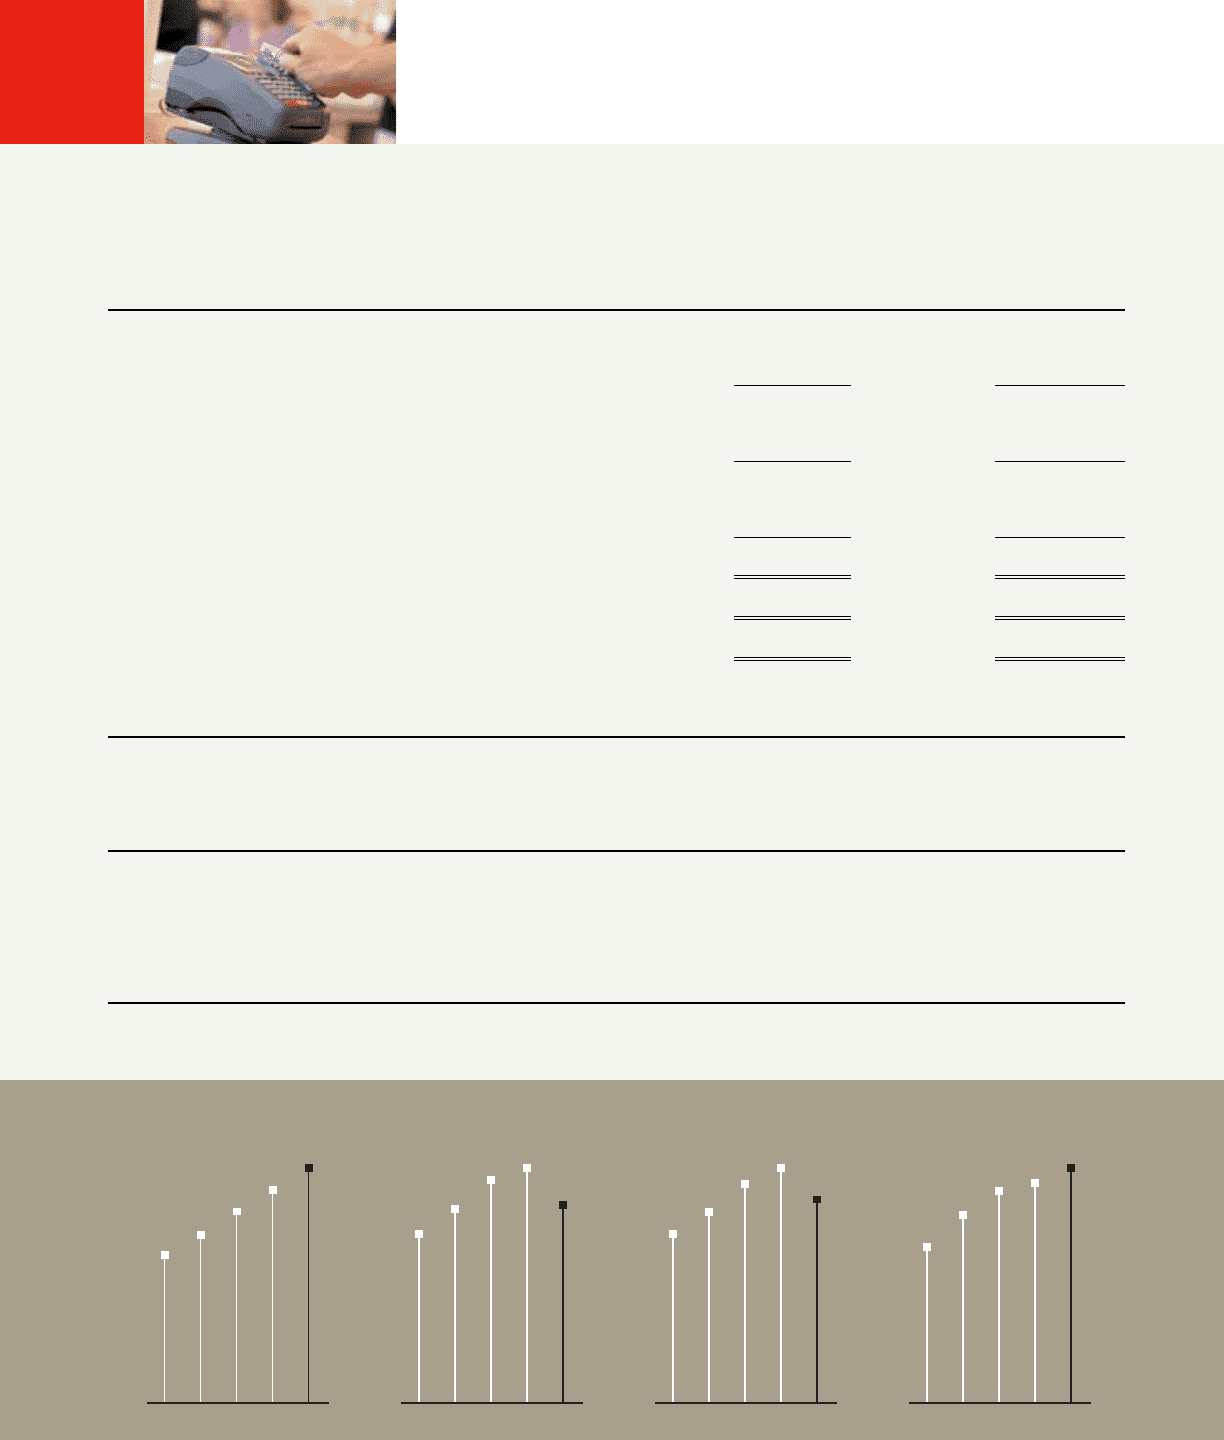
3,665
4,163
4,750
5,282
5,825
186
213
243
258
218
1.08
1.22
1.40
1.50
1.30
949
1,141
1,292
1,337
1,428
’01 ’02 ’03 ’04 ’05 ’01 ’02 ’03 ’04 ’05 ’01 ’02 ’03 ’04 ’05 ’01 ’02 ’03 ’04 ’05
Net Sales
(millions of dollars)
Net Income
(millions of dollars)
Net Income Per
Diluted Common Share
(dollars)
Shareholders’ Equity
(millions of dollars)
Family Dollar Stores, Inc. and Subsidiaries
Financial Highlights
As of August 27, 2005