Exxon 2007 Annual Report Download - page 6
Download and view the complete annual report
Please find page 6 of the 2007 Exxon annual report below. You can navigate through the pages in the report by either clicking on the pages listed below, or by using the keyword search tool below to find specific information within the annual report.-
 1
1 -
 2
2 -
 3
3 -
 4
4 -
 5
5 -
 6
6 -
 7
7 -
 8
8 -
 9
9 -
 10
10 -
 11
11 -
 12
12 -
 13
13 -
 14
14 -
 15
15 -
 16
16 -
 17
17 -
18
-
19
-
20
-
21
-
22
-
23
-
24
-
25
-
26
-
27
-
28
-
29
-
30
-
31
-
32
-
33
-
34
-
35
-
36
-
37
-
38
-
39
-
40
-
41
-
42
-
43
-
44
-
45
-
46
-
47
-
48
-
49
-
50
-
51
-
52
 |
 |

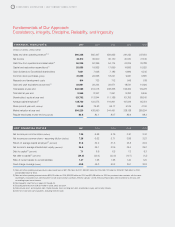
FINANCIAL HIGHLIGHTS
2007
2006 2005 2004 2003
(millions of dollars, unless noted)
Sales and other operating revenue(1)(2) 390,328
365,467
358,955
291,252 237,054
Net income 40,610
39,500
36,130
25,330 21,510
Cash flow from operations and asset sales(3) 56,206
52,366
54,174
43,305 30,788
Capital and exploration expenditures(3) 20,853
19,855
17,699
14,885 15,525
Cash dividends to ExxonMobil shareholders 7,621
7,628
7,185
6,896 6,515
Common stock purchases (gross) 31,822
29,558
18,221
9,951 5,881
Research and development costs 814
733
712
649 618
Cash and cash equivalents at year end(4) 33,981
28,244
28,671
18,531 10,626
Total assets at year end 242,082
219,015
208,335
195,256 174,278
Total debt at year end 9,566
8,347
7,991
8,293 9,545
Shareholders’ equity at year end 121,762
113,844
111,186
101,756 89,915
Average capital employed(3) 128,760
122,573
116,961
107,339 95,373
Share price at year end (dollars) 93.69
76.63
56.17
51.26 41.00
Market valuation at year end 504,220
438,990
344,491
328,128 269,294
Regular employees at year end (thousands) 80.8
82.1
83.7
85.9 88.3
KE Y FINA N CI A L R AT I O S
2007
2006 2005 2004 2003
Net income per common share (dollars) 7.36
6.68
5.76
3.91 3.24
Net income per common share – assuming dilution (dollars) 7.28
6.62
5.71
3.89 3.23
Return on average capital employed(3) (percent) 31.8
32.2
31.3
23.8 20.9
Net income to average shareholders’ equity (percent) 34.5
35.1
33.9
26.4 26.2
Debt to capital(5) (percent) 7.1
6.6
6.5
7.3 9.3
Net debt to capital(6) (percent) (24.0)
(20.4)
(22.0)
(10.7) (1.2)
Ratio of current assets to current liabilities 1.47
1.55
1.58
1.40 1.20
Fixed charge coverage (times) 49.9
46.3
50.2
36.1 30.8
(1) Sales and other operating revenue includes sales-based taxes of $31,728 million for 2007, $30,381 million for 2006, $30,742 million for 2005, $27,263 million for 2004,
and $23,855 million for 2003.
(2) Sales and other operating revenue includes $30,810 million for 2005, $25,289 million for 2004 and $20,936 million for 2003 for purchases/sales contracts with the same
counterparty. Associated costs were included in Crude oil and product purchases. Effective January 1, 2006, these purchases/sales were recorded on a net basis with
no resulting impact on net income.
(3) See Frequently Used Terms on pages 44 through 45.
(4) Excluding restricted cash of $4,604 million in 2006, 2005, and 2004.
(5) Debt includes short- and long-term debt. Capital includes short- and long-term debt, shareholders’ equity, and minority interests.
(6) Debt net of cash and cash equivalents, excluding restricted cash.
Fundamentals of Our Approach:
Consistency, Integrity, Discipline, Reliability, and Ingenuity
E X X O N M O B I L C O R P O R A T I O N • 2 0 0 7 S U M M A R Y A N N U A L R E P O R T
4