Eversource 2005 Annual Report Download - page 14
Download and view the complete annual report
Please find page 14 of the 2005 Eversource annual report below. You can navigate through the pages in the report by either clicking on the pages listed below, or by using the keyword search tool below to find specific information within the annual report.-
 1
1 -
2
-
3
-
 4
4 -
 5
5 -
 6
6 -
 7
7 -
 8
8 -
 9
9 -
 10
10 -
 11
11 -
 12
12 -
 13
13 -
 14
14 -
 15
15 -
 16
16 -
 17
17 -
 18
18 -
 19
19 -
 20
20 -
 21
21 -
 22
22 -
 23
23 -
 24
24 -
25
-
26
-
27
-
28
-
29
-
30
-
31
-
32
-
33
-
34
-
35
-
36
-
37
-
38
-
39
-
40
-
41
-
42
-
43
-
44
-
45
-
46
-
47
-
48
-
49
-
50
-
51
-
52
-
53
-
54
-
55
-
56
-
57
-
58
-
59
-
60
-
61
-
62
-
63
-
64
-
65
-
66
-
67
-
68
-
69
-
70
-
71
-
72
-
73
-
74
-
75
-
76
-
77
-
78
-
79
-
80
-
81
-
82
-
83
-
84
-
85
-
86
-
87
-
88
-
89
-
90
-
91
-
92
-
93
-
94
-
95
-
96
 |
 |

NU’s focus on core electric and natural gas businesses means an investment in poles,
wires, pipes and regulated generation — and profitability — for years to come. Our plan is
clear: Substantial regulated investment will better serve customers and will drive superior
earnings growth.
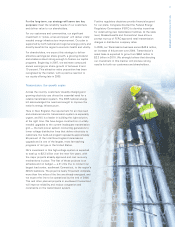
The U.S. Energy Information Agency (EIA) projects that, by 2025, electricity demand in
New England will increase approximately 37 percent over 2002. New telecommunications
and computer technologies, security systems, medical imaging equipment… our lives
and economy become more dependent every day on reliable electric energy.
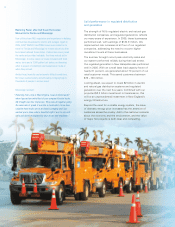
Our commitment to upgrading the area’s energy infrastructure means we are
spending money at the right time, in the right place, for the right reasons.
Our regulated asset base will nearly double over five years. Additionally, our electric
transmission assets will be more than three times larger in 2010.
We expect our construction and upgrade plans to deliver these results:
Improved reliability for customers
Reduction of congestion and constraints on the transmission system
Asset growth of $3 billion by 2010
Regulated earnings per share growth of 8–10 percent beginning in 2007
Growing Value
12
$3.5 billion
$2.4 billion
$650 million
$440 million
$6.5 billion
$3.6 billion
$2.3 billion
$620 million
NU’s Asset Base
Distribution and regulated generation
Transmission
Gas
2005 2010