Epson 2012 Annual Report Download - page 79
Download and view the complete annual report
Please find page 79 of the 2012 Epson annual report below. You can navigate through the pages in the report by either clicking on the pages listed below, or by using the keyword search tool below to find specific information within the annual report.-
 1
1 -
2
-
3
-
4
-
5
-
6
-
7
-
8
-
9
-
10
-
11
-
12
-
13
-
14
-
15
-
16
-
17
-
18
-
19
-
20
-
21
-
22
-
23
-
24
-
25
-
26
-
27
-
28
-
29
-
30
-
31
-
32
-
33
-
34
-
35
-
36
-
37
-
38
-
39
-
40
-
41
-
42
-
43
-
44
-
45
-
46
-
47
-
48
-
49
-
50
-
51
-
52
-
53
-
54
-
55
-
56
-
57
-
58
-
59
-
60
-
61
-
62
-
63
-
64
-
65
-
66
-
67
-
68
-
 69
69 -
 70
70 -
 71
71 -
 72
72 -
 73
73 -
 74
74 -
 75
75 -
 76
76 -
 77
77 -
 78
78 -
 79
79 -
 80
80 -
 81
81 -
 82
82 -
 83
83 -
 84
84 -
 85
85 -
 86
86 -
 87
87 -
 88
88 -
 89
89 -
90
-
91
-
92
-
93
-
94
-
95
-
96
-
97
-
98
-
99
-
100
 |
 |

78
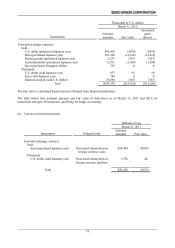
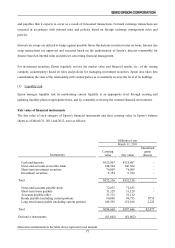
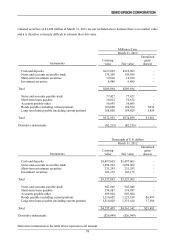
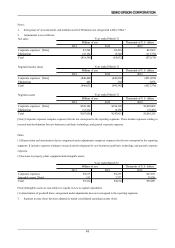
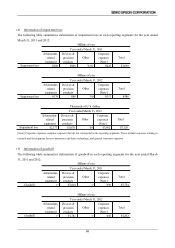
Unlisted securities of ¥1,428 million at March 31, 2011 are not included above because there is no market value
and it is therefore extremely difficult to estimate their fair value.
Millions of yen
March 31, 2012
Instruments
Carrying
value Fair value
Unrealized
gains
(losses)
Cash and deposits ¥123,093 ¥123,093 -
Notes and accounts receivable-trade 139,309 139,309 -
Short-term investment securities 19,010 19,010 -
Investment securities 8,480 8,480 -
Total ¥289,894 ¥289,894 -
Notes and accounts payable-trade 77,427 77,427 -
Short-term loans payable 30,812 30,812 -
Accounts payable-other 56,695 56,695 -
Bonds payable (including current portion) 100,000 100,534 ¥534
Long-term loans payable (including current portion) 108,000 109,429 1,429
Total ¥372,935 ¥374,899 ¥1,963
Derivative instruments (¥2,215) (¥2,215) -
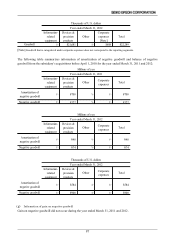
Thousands of U.S. dollars
March 31, 2012
Instruments
Carrying
value Fair value
Unrealized
gains
(losses)
Cash and deposits $1,497,663 $1,497,663 -
Notes and accounts receivable-trade 1,694,962 1,694,962 -
Short-term investment securities 231,293 231,293 -
Investment securities 103,175 103,175 -
Total $3,527,093 $3,527,093 -
Notes and accounts payable-trade 942,048 942,048 -
Short-term loans payable 374,887 374,887 -
Accounts payable-other 689,804 689,804 -
Bonds payable (including current portion) 1,216,692 1,223,189 $6,497
Long-term loans payable (including current portion) 1,314,028 1,331,414 17,386
Total $4,537,459 $4,561,342 $23,883
Derivative instruments ($26,949) ($26,949) -
Derivative instruments in the table above represent a net amount.