Epson 2012 Annual Report Download - page 78
Download and view the complete annual report
Please find page 78 of the 2012 Epson annual report below. You can navigate through the pages in the report by either clicking on the pages listed below, or by using the keyword search tool below to find specific information within the annual report.-
 1
1 -
2
-
3
-
4
-
5
-
6
-
7
-
8
-
9
-
10
-
11
-
12
-
13
-
14
-
15
-
16
-
17
-
18
-
19
-
20
-
21
-
22
-
23
-
24
-
25
-
26
-
27
-
28
-
29
-
30
-
31
-
32
-
33
-
34
-
35
-
36
-
37
-
38
-
39
-
40
-
41
-
42
-
43
-
44
-
45
-
46
-
47
-
48
-
49
-
50
-
51
-
52
-
53
-
54
-
55
-
56
-
57
-
58
-
59
-
60
-
61
-
62
-
63
-
64
-
65
-
66
-
67
-
 68
68 -
 69
69 -
 70
70 -
 71
71 -
 72
72 -
 73
73 -
 74
74 -
 75
75 -
 76
76 -
 77
77 -
 78
78 -
 79
79 -
 80
80 -
 81
81 -
 82
82 -
 83
83 -
 84
84 -
 85
85 -
 86
86 -
 87
87 -
 88
88 -
89
-
90
-
91
-
92
-
93
-
94
-
95
-
96
-
97
-
98
-
99
-
100
 |
 |

77
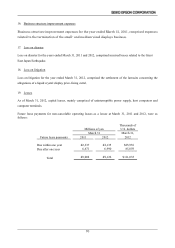
and payables that it expects to occur as a result of forecasted transactions. Forward exchange transactions are
executed in accordance with internal rules and policies based on foreign exchange management rules and
policies.
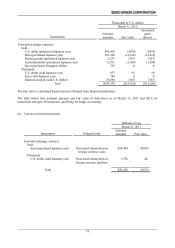
Interest rate swaps are utilized to hedge against possible future fluctuations in interest rates on loans. Interest rate
swap transactions are approved and executed based on the authorization of Epson’s director responsible for
finance based on internal rules and policies concerning financial management.
For investment securities, Epson regularly reviews the market value and financial results, etc., of the issuing
company (counterparty) based on rules and policies for managing investment securities. Epson also takes into
consideration the state of the relationship with counterparties as it constantly reviews the level of its holdings.
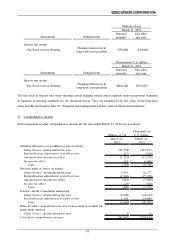
(3) Liquidity risk
Epson manages liquidity risk by maintaining current liquidity at an appropriate level through creating and
updating liquidity plans at appropriate times, and by constantly reviewing the external financial environment.
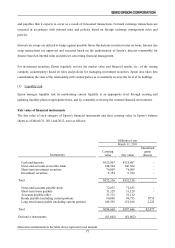
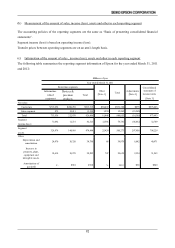
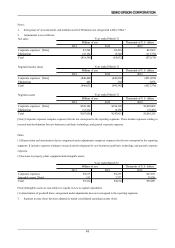
Fair value of financial instruments
The fair value of each category of Epson’s financial instruments and their carrying value in Epson’s balance
sheets as of March 31, 2011 and 2012, were as follows:
Millions of yen
March 31, 2011
Instruments
Carrying
value Fair value
Unrealized
gains
(losses)
Cash and deposits ¥125,807 ¥125,807 -
Notes and accounts receivable-trade 140,564 140,564 -
Short-term investment securities 76,009 76,009 -
Investment securities 9,754 9,754 -
Total ¥352,136 ¥352,136 -
Notes and accounts payable-trade 72,833 72,833 -
Short-term loans payable 31,129 31,129 -
Accounts payable-other 51,112 51,112 -
Bonds payable (including current portion) 90,000 90,755 ¥755
Long-term loans payable (including current portion) 149,593 151,816 2,222
Total ¥394,668 ¥397,646 ¥2,977
Derivative instruments (¥1,602) (¥1,602) -
Derivative instruments in the table above represent a net amount.