Epson 2012 Annual Report Download - page 72
Download and view the complete annual report
Please find page 72 of the 2012 Epson annual report below. You can navigate through the pages in the report by either clicking on the pages listed below, or by using the keyword search tool below to find specific information within the annual report.-
 1
1 -
2
-
3
-
4
-
5
-
6
-
7
-
8
-
9
-
10
-
11
-
12
-
13
-
14
-
15
-
16
-
17
-
18
-
19
-
20
-
21
-
22
-
23
-
24
-
25
-
26
-
27
-
28
-
29
-
30
-
31
-
32
-
33
-
34
-
35
-
36
-
37
-
38
-
39
-
40
-
41
-
42
-
43
-
44
-
45
-
46
-
47
-
48
-
49
-
50
-
51
-
52
-
53
-
54
-
55
-
56
-
57
-
58
-
59
-
60
-
61
-
 62
62 -
 63
63 -
 64
64 -
 65
65 -
 66
66 -
 67
67 -
 68
68 -
 69
69 -
 70
70 -
 71
71 -
 72
72 -
 73
73 -
 74
74 -
 75
75 -
 76
76 -
 77
77 -
 78
78 -
 79
79 -
 80
80 -
 81
81 -
 82
82 -
83
-
84
-
85
-
86
-
87
-
88
-
89
-
90
-
91
-
92
-
93
-
94
-
95
-
96
-
97
-
98
-
99
-
100
 |
 |

71
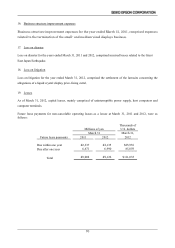
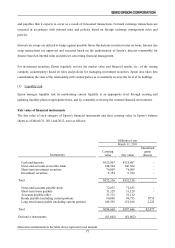
20. Cash flow information
Cash and cash equivalents as of March 31, 2011 and 2012 were as follows:
The Company obtained marketable securities, the fair value of which was ¥10,008 million and ¥7,999 million
($97,323 thousand) as of March 31, 2011 and 2012, respectively, as deposit for the short-term loans receivables
above.
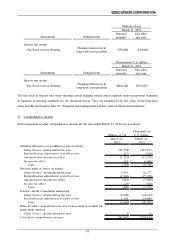
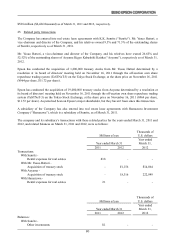
Detail of assets and liabilities for the company which became non-consolidated due to the business transfer.
Detail of assets and liabilities as of transferring date, agreed-upon purchase price and proceeds from sales were as
follows:
Millions of yen Thousands of
U.S. dollars
Current assets ¥21,361 $259,885
Noncurrent assets 1,043 12,690
Current liabilities (11,882) (144,567)
Loss on transfer of subsidiary’s equity (1,043) (12,690)
Agreed-upon purchase price of SZE 9,478 115,318
Cash and cash equivalents of SZE (3,119) (37,961)
Deduction: proceeds from sales ¥6,358 $77,357
¥981 million ($11,935 thousand) is the variance of “loss on transfer of subsidiary’s equity” with the Consolidated
Statements of Income, is due to the influence of the exchange rate.
Thousands of
Millions of yen U.S. dollars
March 31 March 31,
2011 2012 2012
Cash and deposits ¥125,807 ¥123,093 $1,497,663
Short-term investment securities 76,009 19,010 231,293
Short-term loans receivables 10,000 8,000 97,335
Less:
Short-term loans payable (overdrafts) (2) (9) (109)
Time deposits due over three months (27) (54) (669)
Short-term investment securities due over
three months
(10) (10) (121)
Cash and cash equivalents ¥211,777 ¥150,029 $1,825,392