Epson 2009 Annual Report Download - page 5
Download and view the complete annual report
Please find page 5 of the 2009 Epson annual report below. You can navigate through the pages in the report by either clicking on the pages listed below, or by using the keyword search tool below to find specific information within the annual report.-
 1
1 -
 2
2 -
 3
3 -
 4
4 -
 5
5 -
 6
6 -
 7
7 -
 8
8 -
 9
9 -
 10
10 -
 11
11 -
 12
12 -
 13
13 -
 14
14 -
 15
15 -
 16
16 -
17
-
18
-
19
-
20
-
21
-
22
-
23
-
24
-
25
-
26
-
27
-
28
-
29
-
30
-
31
-
32
-
33
-
34
-
35
-
36
-
37
-
38
-
39
-
40
-
41
-
42
-
43
-
44
-
45
-
46
-
47
-
48
-
49
-
50
-
51
-
52
-
53
-
54
-
55
-
56
-
57
-
58
-
59
-
60
-
61
-
62
-
63
-
64
-
65
-
66
-
67
-
68
-
69
-
70
-
71
-
72
-
73
-
74
-
75
-
76
-
77
-
78
-
79
-
80
-
81
-
82
-
83
-
84
-
85
-
86
-
87
-
88
-
89
-
90
 |
 |

4
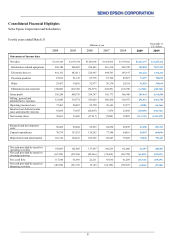
Millions of yen Thousands of
U.S. dollars
2004 2005 2006 2007 2008
2009 2009
Balance sheet data
Current assets ¥709,169 ¥746,712 ¥795,402 ¥813,274 ¥737,245 ¥617,677 $6,288,079
Property, plant and equipment (net of
accumulated depreciation) 393,031 441,355 426,118 379,032 343,261 253,712 2,582,836
Total assets 1,206,491 1,297,790 1,325,206 1,284,412 1,139,165 917,342 9,338,715
Current liabilities 417,573 504,601 507,371 476,125 385,123 283,848 2,889,626
Noncurrent liabilities 372,009 293,662 311,610 313,952 282,595 314,862 3,205,366
Net assets 414,367 472,870 474,520 494,335 471,446 318,631 3,243,723
Number of employees 84,899 85,647 90,701 87,626 88,925 72,326 -
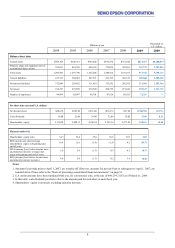
Per share data (yen and U.S. dollars)
Net income (loss) ¥204.70 ¥283.60 (¥91.24) (¥36.13) ¥97.24 (¥566.92) ($5.77)
Cash dividends 18.00 22.00 29.00 32.00 32.00 35.00 0.35
Shareholders’ equity 2,110.20 2,408.13 2,416.54 2,395.14 2,277.45 1,541.16 15.68
Financial ratios (%)
Shareholders’ equity ratio 34.3 36.4 35.8 36.6 39.3 33.0
ROE (net income (loss)/average
shareholders’ equity at beginning and
end of yea
r
)
10.9 12.6 (3.8) (1.5) 4.2 (29.7)
ROA (income (loss) before income taxes
and minority interests/ average total
assets at beginning and end of yea
r
)
5.4 5.9 (1.5) 0.3 4.3 (8.7)
ROS (income (loss) before income taxes
and minority interes
t
/
net sales) 4.6 5.0 (1.3) 0.2 3.9 (8.0)
Notes
1. Amounts for periods prior to April 1, 2007, are rounded off. However, amounts for periods from or subsequent to April 1, 2007, are
rounded down. Please refer to the “Basis of presenting consolidated financial statements” on page 53.
2. U.S. dollar amounts have been translated from yen, for convenience only, at the rate of ¥98.23=U.S.$1 as of March 31, 2009.
3. In this table, cash dividends per share refers to the amount paid for each share in each fiscal year.
4. Shareholders’ equity is net assets excluding minority interests.