Epson 2009 Annual Report Download - page 4
Download and view the complete annual report
Please find page 4 of the 2009 Epson annual report below. You can navigate through the pages in the report by either clicking on the pages listed below, or by using the keyword search tool below to find specific information within the annual report.-
 1
1 -
 2
2 -
 3
3 -
 4
4 -
 5
5 -
 6
6 -
 7
7 -
 8
8 -
 9
9 -
 10
10 -
 11
11 -
 12
12 -
 13
13 -
 14
14 -
 15
15 -
16
-
17
-
18
-
19
-
20
-
21
-
22
-
23
-
24
-
25
-
26
-
27
-
28
-
29
-
30
-
31
-
32
-
33
-
34
-
35
-
36
-
37
-
38
-
39
-
40
-
41
-
42
-
43
-
44
-
45
-
46
-
47
-
48
-
49
-
50
-
51
-
52
-
53
-
54
-
55
-
56
-
57
-
58
-
59
-
60
-
61
-
62
-
63
-
64
-
65
-
66
-
67
-
68
-
69
-
70
-
71
-
72
-
73
-
74
-
75
-
76
-
77
-
78
-
79
-
80
-
81
-
82
-
83
-
84
-
85
-
86
-
87
-
88
-
89
-
90
 |
 |

3
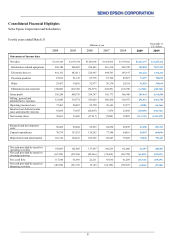
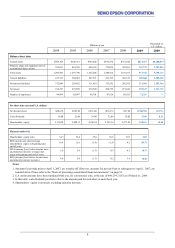
Consolidated Financial Highlights
Seiko Epson Corporation and Subsidiaries
For the years ended March 31
Millions of yen Thousands of
U.S. dollars
2004 2005 2006 2007 2008 2009 2009
Statements of income data
Net sales ¥1,413,243 ¥1,479,750 ¥1,549,568 ¥1,416,032 ¥1,347,841 ¥1,122,497 $11,427,232
Information-related equipment 920,380 946,029 976,443 916,330 902,970 769,850 7,837,252
Electronic devices 441,153 482,611 526,967 444,703 395,197 311,626 3,172,411
Precision products 81,102 81,143 85,778 87,744 83,927 72,697 740,058
Other 29,457 34,510 32,977 30,310 29,124 31,828 324,014
Eliminations and corporate (58,849) (64,543) (72,597) (63,055) (63,378) (63,506) (646,503)
Gross profit 399,284 409,739 354,787 356,773 368,449 289,443 2,946,584
Selling, general and
administrative ex
p
enses 321,883 318,772 329,029 306,430 310,871 291,031 2,962,750
Operating income (loss) 77,401 90,967 25,758 50,343 57,577 (1,588) (16,166)
Income (loss) before income
taxes and minorit
y
interests 65,058 73,647 (20,047) 3,476 52,045 (89,559) (911,727)
Net income (loss) 38,031 55,689 (17,917) (7,094) 19,093 (111,322) (1,133,279)
Research and development
costs 90,485 89,042 92,939 84,690 82,870 82,058 835,365
Capital expenditures 70,379 157,535 118,283 77,548 64,991 58,947 600,091
Depreciation and amortization 110,314 104,241 109,305 89,603 79,209 78,406 798,187
Net cash provided by (used in)
o
p
eratin
g
activities 182,669 162,489 117,497 160,229 112,060 44,253 450,503
Net cash provided by (used in)
investin
g
activities (65,329) (99,396) (95,266) (76,419) (50,770) (61,002) (621,011)
Free cash flow 117,340 63,093 22,231 83,810 61,289 (16,748) (170,497)
Net cash provided by (used in)
financin
g
activities (40,918) (96,373) 19,123 (30,150) (70,663) (9,558) (97,302)