Emerson 2011 Annual Report Download - page 19
Download and view the complete annual report
Please find page 19 of the 2011 Emerson annual report below. You can navigate through the pages in the report by either clicking on the pages listed below, or by using the keyword search tool below to find specific information within the annual report.-
 1
1 -
2
-
3
-
4
-
5
-
6
-
7
-
8
-
 9
9 -
 10
10 -
 11
11 -
 12
12 -
 13
13 -
 14
14 -
 15
15 -
 16
16 -
 17
17 -
 18
18 -
 19
19 -
 20
20 -
 21
21 -
 22
22 -
 23
23 -
 24
24 -
 25
25 -
 26
26 -
 27
27 -
 28
28 -
 29
29 -
30
-
31
-
32
-
33
-
34
-
35
-
36
-
37
-
38
-
39
-
40
-
41
-
42
-
43
-
44
-
45
-
46
-
47
-
48
-
49
-
50
-
51
-
52
-
53
-
54
-
55
-
56
-
57
-
58
 |
 |

Annual Report | 17
holders excluding after-tax net interest expense, divided
by average common stockholders’ equity plus short- and
long-term debt less cash and short-term investments.
Net earnings common stockholders were $2.2 billion
and net earnings per share common stockholders were
$2.84 for 2010, increases of 26 percent and 25 percent
compared with 2009, respectively, including both the
Motors and LANDesk divestiture gains. Net earnings
common stockholders as a percent of net sales were
10.3 percent and 8.6 percent in 2010 and 2009. Return
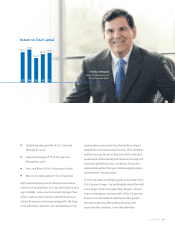
on common stockholders’ equity was 23.6 percent in
2010 compared with 19.5 percent in 2009. Return on
total capital was 18.9 percent in 2010 compared with
16.2 percent in 2009. Net earnings common stockholders
in all years included the aforementioned results from
discontinued operations.
Business Segments
Following is an analysis of segment results for 2011
compared with 2010, and 2010 compared with 2009.
The Company defines segment earnings as earnings
before interest and income taxes.
PROCESS MANAGEMENT
CHANGE CHANGE
(DOLLARS IN MILLIONS) 2009 2010 2011 ‘09 - ‘10 ‘10 - ‘11
Sales $6,135 6,022 7,000 (2)% 16%
Earnings $1,060 1,093 1,402 3% 28%
Margin 17.3% 18.1% 20.0%
2011 vs. 2010 – Process Management sales were
$7.0 billion in 2011, an increase of $978 million as all busi-
nesses reported higher sales, led by very strong results
for the measurement and flow business, valves business
and systems and solutions business as a result of growth
in the oil and gas, chemical, power and refining end
markets. Underlying sales increased 14 percent on higher
volume, which includes some market penetration gains,
and foreign currency translation had a 2 percent
($120 million) favorable impact. Underlying sales
increased in all major geographic regions, including the
United States (14 percent), Asia (18 percent), Europe
(8 percent), Canada (38 percent), Latin America
(15 percent) and Middle East/Africa (7 percent). Earn-
ings increased 28 percent, to $1,402 million, and margin
increased approximately 2 percentage points, primarily
due to higher sales volume and resulting leverage,
savings from prior period cost reductions, $24 million
lower restructuring expense, and an $8 million favorable
impact from foreign currency transactions compared to
prior year, partially offset by increased business develop-
ment investments, wages and other costs.
2010 vs. 2009 – Process Management sales were
$6.0 billion in 2010, a decrease of $113 million, reflecting
a 7 percent decline in underlying sales on lower volume, a
3 percent ($178 million) favorable impact primarily from
the Roxar acquisition and a 2 percent ($121 million) favor-
able impact from foreign currency translation. The valves
business reported lower sales primarily as a result of
weakness in the chemical, refining and marine markets.
Sales for the systems and solutions and measurement and
flow businesses were down slightly, while sales for the
regulators business were up slightly. Regionally, under-
lying sales declined in all geographic areas, including
1 percent in the United States, 9 percent each in Asia,
Europe and Middle East/Africa, 11 percent in Canada
and 10 percent in Latin America. Earnings increased
$33 million, to $1,093 million, and margin increased,
reflecting savings from significant cost reduction
actions, materials cost containment, lower restructuring
costs of $20 million and a $17 million favorable impact
from foreign currency transactions, partially offset by
deleverage on lower sales volume and higher wage costs.
EARNINGS PER SHARE FROM
CONTINUING OPERATIONS
Earnings per share from continuing operations common
stockholders were $3.24 in 2011, a 25 percent increase over
the prior year.
07
$2.60
11100908
$3.10
$2.26
$2.60
$3.24