Emerson 2011 Annual Report Download - page 16
Download and view the complete annual report
Please find page 16 of the 2011 Emerson annual report below. You can navigate through the pages in the report by either clicking on the pages listed below, or by using the keyword search tool below to find specific information within the annual report.-
 1
1 -
2
-
3
-
4
-
5
-
 6
6 -
 7
7 -
 8
8 -
 9
9 -
 10
10 -
 11
11 -
 12
12 -
 13
13 -
 14
14 -
 15
15 -
 16
16 -
 17
17 -
 18
18 -
 19
19 -
 20
20 -
 21
21 -
 22
22 -
 23
23 -
 24
24 -
 25
25 -
 26
26 -
27
-
28
-
29
-
30
-
31
-
32
-
33
-
34
-
35
-
36
-
37
-
38
-
39
-
40
-
41
-
42
-
43
-
44
-
45
-
46
-
47
-
48
-
49
-
50
-
51
-
52
-
53
-
54
-
55
-
56
-
57
-
58
 |
 |

14 | 2011 Emerson
10 percent and an estimated 1 percent from higher
selling prices as sales increased 13 percent internationally,
including Asia (11 percent), Europe (11 percent), Latin
America (20 percent), Middle East/Africa (16 percent)
and Canada (20 percent). Underlying sales increased
8 percent in the United States.
Net sales for 2010 were $21.0 billion, an increase of
$937 million, or 5 percent from 2009. Sales growth was
strong in Climate Technologies, aided by China stimulus
programs, while Network Power, Tools and Storage, and
Industrial Automation increased primarily due to acquisi-
tions and favorable foreign currency translation. Process
Management was down as end markets were strongly
impacted by the economic slowdown. Consolidated
results reflected a 1 percent ($102 million) decline in
underlying sales, a 4 percent ($738 million) contribution
from acquisitions and a 2 percent ($301 million) favor-
able impact from foreign currency translation. Underlying
sales reflected a decline in volume as sales decreased
2 percent internationally, including Europe (7 percent),
Middle East/Africa (10 percent), Canada (9 percent) and
Latin America (2 percent), partially offset by an increase
in Asia (7 percent). Underlying sales increased 1 percent
in the United States.
INTERNATIONAL SALES
Emerson is a global business for which international
sales, including non-U.S. acquisitions, have grown
over the years and now represent 59 percent of the
Company’s total sales. The Company expects this trend
to continue due to faster economic growth in emerging
markets in Asia, Latin America, Eastern Europe and
Middle East/Africa.
International destination sales, including U.S. exports,
increased approximately 20 percent, to $14.3 billion in
2011, reflecting increases in Network Power, Industrial
Automation and Process Management as well as benefits
from acquisitions. U.S. exports of $1,520 million were up
15 percent compared with 2010. Underlying destination
sales increased 11 percent in Asia, including 12 percent
growth in China, 11 percent in Europe, 20 percent in Latin
America, 16 percent in Middle East/Africa and 20 percent
in Canada. International subsidiary sales, including ship-
ments to the United States, were $12.8 billion in 2011,
up 20 percent from 2010. Excluding an 8 percent net
favorable impact from acquisitions and foreign currency
translation, international subsidiary sales increased
12 percent compared with 2010.
International destination sales, including U.S. exports,
increased approximately 5 percent, to $11.9 billion
in 2010, reflecting increases in Climate Technologies,
Network Power and Industrial Automation as well as
benefits from acquisitions and a weaker U.S. dollar. U.S.
exports of $1,317 million were up 9 percent compared
with 2009. Underlying destination sales decreased
7 percent in Europe, 10 percent in Middle East/Africa and
2 percent in Latin America, partially offset by a 7 percent
increase in Asia that includes 13 percent growth in China.
International subsidiary sales, including shipments to the
United States, were $10.7 billion in 2010, up 4 percent
from 2009. Excluding a 7 percent net favorable impact
from acquisitions and foreign currency translation,
international subsidiary sales decreased 3 percent
compared with 2009.
ACQUISITIONS
The Company acquired several small businesses during
2011, mainly in the Process Management and Climate
Technologies segments, all of which were complemen-
tary to the existing business portfolio. Total cash paid for
all businesses in 2011 was approximately $232 million.
Annualized sales for businesses acquired in 2011 were
approximately $100 million. See Note 3 for additional
information.
In 2010, the Company acquired Chloride Group PLC and
Avocent Corporation. Chloride provides commercial
and industrial uninterruptible power supply systems and
services, which significantly strengthened the Company’s
network power systems business in Europe. Avocent is a
leader in delivering solutions that enhance companies’
integrated data center management capabilities and the
acquisition strongly positioned the Company to benefit
from the growing importance of infrastructure manage-
ment in data centers worldwide. Chloride and Avocent,
together with the Company’s other existing offerings,
create a global leader in providing integrated data center
management solutions. The Company also acquired SSB
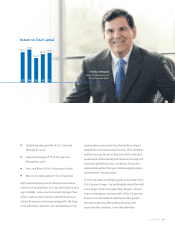
SALES BY GEOGRAPHIC DESTINATION
n United States and Canada n Latin America
n Europe n Middle East/Africa
n Asia
5%
45%
22%
23%
5%