Emerson 2011 Annual Report Download - page 18
Download and view the complete annual report
Please find page 18 of the 2011 Emerson annual report below. You can navigate through the pages in the report by either clicking on the pages listed below, or by using the keyword search tool below to find specific information within the annual report.
16 | 2011 Emerson
EARNINGS FROM CONTINUING OPERATIONS
Earnings and earnings per share from continuing opera-
tions common stockholders were $2.5 billion and $3.24,
respectively, for 2011, increases of 24 percent and
25 percent, compared with $2.0 billion and $2.60 for
2010. Earnings increased primarily due to higher sales
and resulting leverage, cost reduction savings, a decrease
in incentive stock compensation expense and lower
interest expense, slightly offset by higher materials and
wage costs. Earnings improved $309 million in Process
Management, $239 million in Industrial Automation,
$18 million in Tools and Storage, and $18 million in Climate
Technologies, slightly offset by a $44 million decrease in
Network Power. See the Business Segments discussion
that follows and Note 16 for additional information.
Earnings and earnings per share from continuing opera-
tions common stockholders were $2.0 billion and $2.60,
respectively, for 2010, both increases of 15 percent,
compared with $1.7 billion and $2.26 for 2009. Earnings
increased in all segments, reflecting decreased rational-
ization expense, savings from cost reduction actions and
favorable foreign currency translation. Earnings improved
$280 million in Climate Technologies, $221 million in
Network Power, $121 million in Industrial Automation,
$81 million in Tools and Storage and $33 million in
Process Management. Earnings per share were negatively
impacted $0.10 per share by the Avocent and Chloride
acquisitions, including acquisition accounting charges,
the expensing of deal costs and interest expense.
DISCONTINUED OPERATIONS
In the fourth quarter of 2011, the Company sold its
heating elements unit for $73 million, resulting in an
after-tax gain of $21 million ($30 million of income
taxes). Fourth quarter 2011 heating elements sales
were $12 million and net earnings were $1 million. The
after-tax gain on divestiture and fourth quarter operating
results for heating elements, and the impact of finalizing
the 2010 Motors and LANDesk divestitures, have been
classified as discontinued operations for 2011. Prior fiscal
2011 quarters and prior year results of operations for
heating elements were inconsequential and have not
been reclassified.
LANDesk (acquired with Avocent in 2010) was sold in the
fourth quarter of 2010 for proceeds of approximately
$230 million, resulting in an after-tax gain of $12 million
($10 million of income taxes). LANDesk was classified as
discontinued operations throughout 2010. Also in the
fourth quarter of 2010, the Company sold its appliance
motors and U.S. commercial and industrial motors busi-
nesses (Motors) for proceeds of $622 million, resulting in
an after-tax gain of $155 million ($126 million of income
taxes). Motors had total annual sales of $827 million and
$813 million and net earnings, excluding the divestiture
gain, of $38 million and $9 million in 2010 and 2009,
respectively. Results of operations for Motors have
been reclassified into discontinued operations for 2010
and prior.
As noted above, 2011 income from discontinued opera-
tions includes the fourth quarter operating results and
gain on disposition for heating elements. Income from
discontinued operations in 2010 reflects the Motors
and LANDesk divestitures and includes both operating
results for the year and the gains on disposition. The
income from discontinued operations reported for 2009
relates only to the operations of the Motors businesses.
See Acquisitions and Divestitures discussion in Note 3 for
additional information regarding discontinued operations.
NET EARNINGS, RETURN ON EQUITY AND
RETURN ON TOTAL CAPITAL
Net earnings common stockholders were $2.5 billion
and net earnings per share common stockholders were
$3.27 for 2011, both increases of 15 percent compared
with 2010, due to the same factors discussed previously,
plus $26 million related to discontinued operations. Net
earnings common stockholders as a percent of net sales
were 10.2 percent and 10.3 percent in 2011 and 2010.
Return on common stockholders’ equity (net earnings
common stockholders divided by average common
stockholders’ equity) was 24.6 percent in 2011 compared
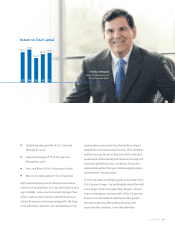
with 23.6 percent in 2010. Return on total capital was
19.6 percent in 2011 compared with 18.9 percent in
2010, and is computed as net earnings common stock-
EARNINGS FROM CONTINUING
OPERATIONS (dollars in billions)
Earnings from continuing operations common stockholders were
$2.5 billion in 2011, a 24 percent increase over the prior year.
07
$2.1
11100908
$2.4
$1.7
$2.0
$2.5


