Emerson 2004 Annual Report Download - page 6
Download and view the complete annual report
Please find page 6 of the 2004 Emerson annual report below. You can navigate through the pages in the report by either clicking on the pages listed below, or by using the keyword search tool below to find specific information within the annual report.-
 1
1 -
 2
2 -
 3
3 -
 4
4 -
 5
5 -
 6
6 -
 7
7 -
 8
8 -
 9
9 -
 10
10 -
 11
11 -
 12
12 -
 13
13 -
 14
14 -
 15
15 -
 16
16 -
 17
17 -
18
-
19
-
20
-
21
-
22
-
23
-
24
-
25
-
26
-
27
-
28
-
29
-
30
-
31
-
32
-
33
-
34
-
35
-
36
-
37
-
38
-
39
-
40
-
41
-
42
-
43
-
44
-
45
-
46
-
47
-
48
-
49
-
50
-
51
-
52
-
53
-
54
-
55
-
56
-
57
-
58
-
59
 |
 |

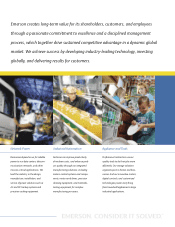
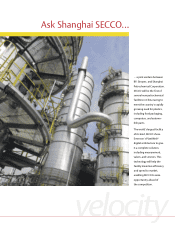
We have a deep commitment to
investing in people, fixed assets,
acquisitions, and service capabilities
that strengthen our global position
and extend our reach to better serve
customers and compete effectively.
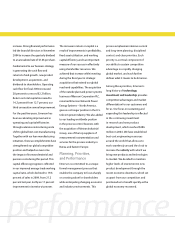
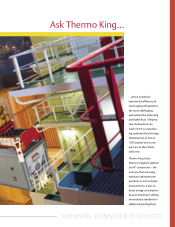
The goal is to be closer to customers
wherever they are – to better
understand their markets, customize
product platforms, and combine
local support with our best-cost
manufacturing positions worldwide.
Significant sales growth outside the
United States is one measure of our
long-term success, particularly in
emerging growth markets. In 2004,
sales to emerging markets grew
more than 20 percent to $3.2 billion,
including a 34 percent increase in China
and very strong double-digit increases
in Eastern Europe and Russia.
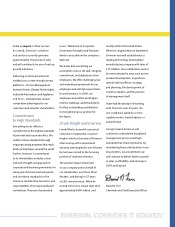
Over the past several years we have
made significant progress transforming
Emerson to a company with a more
intense customer focus. Combining
industry-leading products with
comprehensive solutions and services
enables our customers to differentiate
themselves in their markets. Listening
to our customers and to their end
customers allows us to deliver truly
unique and innovative solutions that
One-Year Performance
Years ended September 30
(Dollars in millions except per share amounts)
Five-Year Performance
Years ended September 30
(Dollars in millions except per share amounts)
1999 2004 5-Year CAGR
Sales $14,270 $15,615 1.8%
Net Earnings $1,314 $1,257 (0.9%)
Net Earnings Per Share $3.00 $2.98 (0.1%)
Dividends Per Share $1.30 $1.60 4.2%
Operating Cash Flow $1,811 $2,216 4.1%
Return on Total Capital 16.4% 14.2%
Return on Equity 21.9% 18.4%
4Emerson 2004
2003 2004 Change
Sales $13,958 $15,615 11.9%
Net Earnings $1,089 $1,257 15.4%
EPS, Continuing Operations $2.41 $2.98 23.7%
Net Earnings Per Share $2.59 $2.98 15.1%
Dividends Per Share $1.57 $1.60 1.9%
Operating Cash Flow $1,731 $2,216 28.0%
Return on Total Capital 12.7% 14.2%
Return on Equity 17.9% 18.4%
Percent