Eli Lilly 2008 Annual Report Download - page 3
Download and view the complete annual report
Please find page 3 of the 2008 Eli Lilly annual report below. You can navigate through the pages in the report by either clicking on the pages listed below, or by using the keyword search tool below to find specific information within the annual report.-
 1
1 -
 2
2 -
 3
3 -
 4
4 -
 5
5 -
 6
6 -
 7
7 -
 8
8 -
 9
9 -
 10
10 -
 11
11 -
 12
12 -
 13
13 -
 14
14 -
15
-
16
-
17
-
18
-
19
-
20
-
21
-
22
-
23
-
24
-
25
-
26
-
27
-
28
-
29
-
30
-
31
-
32
-
33
-
34
-
35
-
36
-
37
-
38
-
39
-
40
-
41
-
42
-
43
-
44
-
45
-
46
-
47
-
48
-
49
-
50
-
51
-
52
-
53
-
54
-
55
-
56
-
57
-
58
-
59
-
60
-
61
-
62
-
63
-
64
-
65
-
66
-
67
-
68
-
69
-
70
-
71
-
72
-
73
-
74
-
75
-
76
-
77
-
78
-
79
-
80
-
81
-
82
-
83
-
84
-
85
-
86
-
87
-
88
-
89
-
90
-
91
-
92
-
93
-
94
-
95
-
96
-
97
-
98
-
99
-
100
-
101
-
102
-
103
-
104
-
105
-
106
-
107
-
108
-
109
-
110
-
111
-
112
-
113
-
114
-
115
-
116
-
117
-
118
-
119
-
120
-
121
-
122
-
123
-
124
-
125
-
126
-
127
-
128
-
129
-
130
-
131
-
132
 |
 |

1
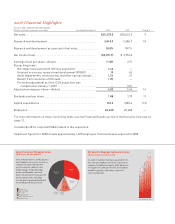
2008 Financial Highlights
ELI LILLY AND COMPANY AND SUBSIDIARIES
(Dollars in millions, except per-share data) Year Ended December 31 2008 2007 Change %
Net sales . . . . . . . . . . . . . . . . . . . . . . . . . . . . . . . . . . . . . . . . . . . . . . . . . . $20,378.0 $18,633.5 9
Research and development . . . . . . . . . . . . . . . . . . . . . . . . . . . . . . . . . . 3,840.9 3,486.7 10
Research and development as a percent of net sales . . . . . . . . . . . . . 18.8% 18.7%
Net income (loss) . . . . . . . . . . . . . . . . . . . . . . . . . . . . . . . . . . . . . . . . . . . $(2,071.9) $ 2,953.0
Earnings (loss) per share—diluted . . . . . . . . . . . . . . . . . . . . . . . . . . . . (1.89) 2.71
Reconciling items1:
Net impact associated with ImClone acquisition2 . . . . . . . . . . . . . . 4.46 —
Acquired in-process research and development (IPR&D) . . . . . . .10 .63
Asset impairments, restructuring, and other special charges . . . 1.54 .21
Benefi t from resolution of IRS audit . . . . . . . . . . . . . . . . . . . . . . . . . (.19) —
Pro forma adjustment as if the ICOS acquisition was
completed on January 1, 2007 . . . . . . . . . . . . . . . . . . . . . . . . . . . — (.01)
Adjusted earnings per share—diluted. . . . . . . . . . . . . . . . . . . . . . . . . . 4.02 3.54 14
Dividends paid per share. . . . . . . . . . . . . . . . . . . . . . . . . . . . . . . . . . . . . 1.88 1.70 11
Capital expenditures . . . . . . . . . . . . . . . . . . . . . . . . . . . . . . . . . . . . . . . . 947.2 1,082.4 (12)
Employees . . . . . . . . . . . . . . . . . . . . . . . . . . . . . . . . . . . . . . . . . . . . . . . . 40,4503 40,600 —
1For more information on these reconciling items, see the Financial Results section of the Executive Overview on
page 12.
2Includes $4.28 for acquired IPR&D related to this acquisition.
3Headcount fi gures for 2008 include approximately 1,600 employees from businesses acquired in 2008.
Net Sales Per Employee Continue to Increase
($ thousands, percent growth)
In 2008, we continued our focus on productivity.
Net sales per employee increased 10 percent to
$504,000. Excluding the impact of the businesses
we acquired in 2008, our net sales per employee
would be $525,000, reflecting a 14 percent
increase from 2007.
04 05 06 07 08
$459 +21%
$378 +10%
$311 +11%
$344 +11%
$504 +10%
Sales Grow Across Therapeutic Areas
($ millions, percent growth)
Sales in Neurosciences, led by Zyprexa
and Cymbalta, increased 7 percent as
compared to 2007 and represent
41 percent of our 2008 net sales.
Endocrinology, led by Humalog,
Evista, and Humulin, increased
8 percent and represents 29 percent
of our 2008 net sales. Oncology
was our fastest growing therapeutic
area with growth of 17 percent.
Neuroscience
Endocrinology
Oncology
Cardiovascular
Other Pharmaceutical
Animal Health
$1,093.3
+10% $265.4
+12%
$1,882.7
+16%
$2,874.4
+17%
$8,371.5
+7%
$5,890.7
+8%