DuPont 2005 Annual Report Download - page 20
Download and view the complete annual report
Please find page 20 of the 2005 DuPont annual report below. You can navigate through the pages in the report by either clicking on the pages listed below, or by using the keyword search tool below to find specific information within the annual report.-
 1
1 -
2
-
3
-
4
-
5
-
6
-
7
-
8
-
9
-
 10
10 -
 11
11 -
 12
12 -
 13
13 -
 14
14 -
 15
15 -
 16
16 -
 17
17 -
 18
18 -
 19
19 -
 20
20 -
 21
21 -
 22
22 -
 23
23 -
 24
24 -
 25
25 -
 26
26 -
 27
27 -
 28
28 -
 29
29 -
 30
30 -
31
-
32
-
33
-
34
-
35
-
36
-
37
-
38
-
39
-
40
-
41
-
42
-
43
-
44
-
45
-
46
-
47
-
48
-
49
-
50
-
51
-
52
-
53
-
54
-
55
-
56
-
57
-
58
-
59
-
60
-
61
-
62
-
63
-
64
-
65
-
66
-
67
-
68
-
69
-
70
-
71
-
72
-
73
-
74
-
75
-
76
-
77
-
78
-
79
-
80
-
81
-
82
-
83
-
84
-
85
-
86
-
87
-
88
-
89
-
90
-
91
-
92
-
93
-
94
-
95
-
96
-
97
-
98
-
99
-
100
-
101
-
102
-
103
-
104
-
105
-
106
-
107
-
108
-
109
-
110
-
111
-
112
-
113
-
114
-
115
-
116
-
117
 |
 |

Part II
Item 7. Management’s Discussion and Analysis of Financial Condition and Results of Operations–Continued
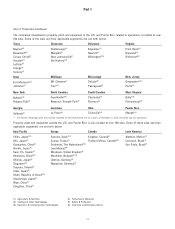
The tables below show a regional breakdown of 2005 and 2004 consolidated net sales based on location of customers and
percentage variances from prior year:
2005 Percent Percent Change Due to:
Net Change Local Currency
(Dollars in billions) Sales vs. 2004 Price Effect Volume Other1
Worldwide2$26.6 (3) 5 1 (1) (8)
United States 11.1 (4) 6 0 (2) (8)
Europe 7.7 (4) 3 2 (3) (6)
Asia Pacific 4.5 (4) 5 1 2 (12)
Canada & Latin America 3.3 9 4 6 4 (5)
1Percentage changes in sales due to the absence of $2,108 million in sales attributable to the divested Textiles & Interiors business in 2004.
2Sales related to elastomers businesses transferred to Dow on June 30, 2005 were $386 million and $467 million in 2005 and 2004, respectively, primarily in the
United States and Asia Pacific. Excluding these sales, the company’s worldwide sales were $26.2 billion in 2005, down 2 percent from 2004 with volume
essentially flat.
In 2005, growth in key markets, particularly those in Asia Pacific and Latin America, helped offset the reduction in U.S.
volumes. Volume declines in the United States and Europe were related to lower demand in motor vehicle and production
agriculture markets, and the impact of hurricanes.
2004 versus 2003 Consolidated net sales for 2004 were $27.3 billion, up one percent. Portfolio changes, principally the sale of
INVISTA, partly offset by the consolidation of DuPont Dow Elastomers LLC (DDE) as a variable interest entity (VIE) and the
benefit of small acquisitions, resulted in a $2.6 billion or 10 percent reduction in Net sales. The combination of higher sales
volumes and USD selling prices increased sales 11 percent.
2004 Percent Percent Change Due to:
Net Change Local Currency
(Dollars in billions) Sales vs. 2003 Price Effect Volume Other*
Worldwide $27.3 1 2 3 6 (10)
United States 11.6 (4) 3 0 4 (11)
Europe 8.0 8 1 10 4 (7)
Asia Pacific 4.7 4 1 3 14 (14)
Canada & Latin America 3.0 4 1 2 8 (7)
*Includes the reduction in sales following the sale of INVISTA, and additions to sales resulting from small acquisitions and the consolidation of a joint venture.
In 2004, the company saw strength in its major markets, including motor vehicle production and related after-markets, produc-
tion agriculture and construction. Growth in these key markets, particularly in Asia Pacific, as well as increased market share,
contributed to a 6 percent increase in worldwide sales volumes, which helped offset a $3.8 billion reduction in sales as a
result of the sale of INVISTA.
(Dollars in millions) 2005 2004 2003
OTHER INCOME, NET $1,852 $655 $734
2005 versus 2004 Other income increased $1,197 million over 2004. The increase is primarily due to net pre-tax exchange
gains in 2005 of $423 million compared to losses in 2004 of $391 million (see page 52 for a discussion of the company’s
program to manage currency risk and Note 2 to the Consolidated Financial Statements). The company records royalty revenues
20