Dominion Power 2007 Annual Report Download - page 3
Download and view the complete annual report
Please find page 3 of the 2007 Dominion Power annual report below. You can navigate through the pages in the report by either clicking on the pages listed below, or by using the keyword search tool below to find specific information within the annual report.-
 1
1 -
 2
2 -
 3
3 -
 4
4 -
 5
5 -
 6
6 -
 7
7 -
 8
8 -
 9
9 -
 10
10 -
 11
11 -
 12
12 -
 13
13 -
 14
14 -
15
-
16
-
17
-
18
-
19
-
20
-
21
-
22
-
23
-
24
-
25
-
26
-
27
-
28
-
29
-
30
-
31
-
32
-
33
-
34
-
35
-
36
-
37
-
38
-
39
-
40
-
41
-
42
-
43
-
44
-
45
-
46
-
47
-
48
-
49
-
50
-
51
-
52
-
53
-
54
-
55
-
56
-
57
-
58
-
59
-
60
-
61
-
62
-
63
-
64
-
65
-
66
-
67
-
68
-
69
-
70
-
71
-
72
-
73
-
74
-
75
-
76
-
77
-
78
-
79
-
80
-
81
-
82
-
83
-
84
-
85
-
86
-
87
-
88
-
89
-
90
-
91
-
92
-
93
-
94
-
95
-
96
-
97
-
98
-
99
-
100
-
101
-
102
-
103
-
104
-
105
-
106
-
107
-
108
-
109
-
110
-
111
-
112
-
113
-
114
-
115
-
116
-
117
-
118
-
119
-
120
 |
 |

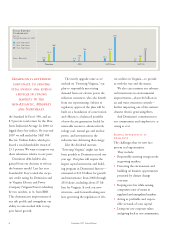
Dominion 2007 Annual Report 1
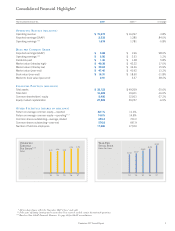
Year Ended December 31, 2007 2006** % Change
OPERATING RESULTS (MILLIONS)
Operating revenue $ 15,674 $ 16,297 -3.8%
Reported earnings (GAAP) 2,539 1,380 84.0%
Operating earnings*** 1,678 1,781 -5.8%
DATA PER COMMON SHARE
Reported earnings (GAAP) $ 3.88 $ 1.96 98.0%
Operating earnings*** $ 2.56 $ 2.53 1.2%
Dividends paid $ 1.46 $ 1.38 5.8%
Market value (intraday high) $ 49.38 $ 42.22 17.0%
Market value (intraday low) $ 39.84 $ 34.36 15.9%
Market value (year-end) $ 47.45 $ 41.92 13.2%
Book value (year-end) $ 16.31 $ 18.50 -11.8%
Market to book value (year-end) 2.91 2.27 28.2%
FINANCIAL POSITION (MILLIONS)
Total assets $ 39,123 $ 49,269 -20.6%
Total debt 16,469 19,601 -16.0%
Common shareholders’ equity 9,406 12,913 -27.2%
Equity market capitalization 27,369 29,257 -6.5%
OTHER STATISTICS (SHARES IN MILLIONS)
Return on average common equity—reported 22.1% 11.4%
Return on average common equity—operating*** 14.6% 14.8%
Common shares outstanding—average, diluted 655.2 703.2
Common shares outstanding—year-end 576.8 697.9
Number of full-time employees 17,000 17,500
Consolidated Financial Highlights*
Operating
Earnings
Per Share***
Dollars
’07
’03 ’04 ’05 ’06
2.21 2.28 2.26
2.53 2.56
Year-End
Stock Price
Dollars Per Share
’07
’03 ’04 ’05 ’06
31.92 33.87
38.60
41.92
47.45
* All per-share figures reflect the November 2007 2-for-1 stock split.
** Prior years’ operating earnings and revenue have been recast to exclude certain discontinued operations.
*** Based on Non-GAAP Financial Measures. See page 26 for GAAP reconciliations.