Dollar Rent A Car 2011 Annual Report Download - page 9
Download and view the complete annual report
Please find page 9 of the 2011 Dollar Rent A Car annual report below. You can navigate through the pages in the report by either clicking on the pages listed below, or by using the keyword search tool below to find specific information within the annual report.-
 1
1 -
 2
2 -
 3
3 -
 4
4 -
 5
5 -
 6
6 -
 7
7 -
 8
8 -
 9
9 -
 10
10 -
 11
11 -
 12
12 -
 13
13 -
 14
14 -
 15
15 -
 16
16 -
 17
17 -
 18
18 -
 19
19 -
 20
20 -
21
-
22
-
23
-
24
-
25
-
26
-
27
-
28
-
29
-
30
-
31
-
32
-
33
-
34
-
35
-
36
-
37
-
38
-
39
-
40
-
41
-
42
-
43
-
44
-
45
-
46
-
47
-
48
-
49
-
50
-
51
-
52
-
53
-
54
-
55
-
56
-
57
-
58
-
59
-
60
-
61
-
62
-
63
-
64
-
65
-
66
-
67
-
68
-
69
-
70
-
71
-
72
-
73
-
74
-
75
-
76
-
77
-
78
-
79
-
80
-
81
-
82
-
83
-
84
-
85
-
86
-
87
-
88
-
89
-
90
-
91
-
92
-
93
-
94
-
95
-
96
-
97
-
98
-
99
-
100
-
101
-
102
-
103
-
104
-
105
-
106
-
107
-
108
-
109
-
110
-
111
-
112
-
113
-
114
-
115
-
116
-
117
-
118
-
119
-
120
-
121
-
122
-
123
-
124
-
125
-
126
-
127
-
128
-
129
-
130
-
131
-
132
-
133
-
134
-
135
-
136
-
137
-
138
-
139
-
140
-
141
-
142
-
143
-
144
-
145
-
146
-
147
-
148
-
149
-
150
-
151
-
152
-
153
-
154
-
155
-
156
-
157
-
158
-
159
-
160
-
161
-
162
-
163
-
164
-
165
-
166
-
167
-
168
-
169
-
170
-
171
-
172
-
173
-
174
-
175
-
176
-
177
-
178
-
179
-
180
 |
 |

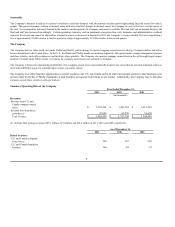
Seasonality
The Company’s business is subject to seasonal variations in customer demand, with the summer vacation period representing the peak season for vehicle
rentals. This general seasonal variation in demand, along with more localized changes in demand, causes the Company to vary its fleet size over the course of
the year. To accommodate increased demand in the summer vacation period, the Company increases its available fleet and staff and as demand declines, the
fleet and staff are decreased accordingly. Certain operating expenses, such as minimum concession fees, rent, insurance and administrative overhead
represent fixed costs and cannot be adjusted for seasonal increases or decreases in demand. In 2011, the Company’s average monthly fleet size ranged from a
low of approximately 94,000 vehicles in the first quarter to a high of approximately 118,000 vehicles in the second quarter.
The Company
The Company has two value rental car brands, Dollar and Thrifty, with a strategy to operate company-owned stores in the top 75 airport markets and in key
leisure destinations in the United States. In the U.S., the Dollar and Thrifty brands are marketed separately, but operate under a single management structure
and share vehicles, back-office employees and facilities, where possible. The Company also operates company-owned stores in five of the eight largest airport
markets in Canada under DTG Canada. In Canada, the company-owned stores are primarily co-branded.
The Company is focused on maximizing profitability of its company-owned stores and continually monitors any stores that do not meet minimum return on
asset and profitability targets for potential improvements or possible closure.
The Company also offers franchise opportunities in smaller markets in the U.S. and Canada and in all other international markets so that franchisees can
operate under the Dollar or Thrifty trademarks or dual franchise and operate both brands in one market. Additionally, the Company may re-franchise
company-owned stores outside its strategic markets.
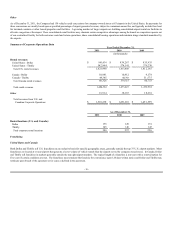
Summary Operating Data of the Company
Year Ended December 31,
2011 2010 2009
(in thousands)
Revenues:
Revenue from U.S. and
Canada company-owned
stores $ 1,501,238 $ 1,491,210 $ 1,491,599
Revenue from franchisees
and other (a) 47,690 45,950 54,650
Total revenues $ 1,548,928 $ 1,537,160 $ 1,546,249
(a) Includes fleet leasing revenues of $5.1 million, $7.0 million and $16.4 million in 2011, 2010 and 2009, respectively.
As of December 31,
2011 2010 2009
Rental locations:
U.S. and Canada company-
owned stores 280 297 296
U.S. and Canada franchisee
locations 306 308 317
- 8 -