Discover 2009 Annual Report Download - page 6
Download and view the complete annual report
Please find page 6 of the 2009 Discover annual report below. You can navigate through the pages in the report by either clicking on the pages listed below, or by using the keyword search tool below to find specific information within the annual report.-
 1
1 -
 2
2 -
 3
3 -
 4
4 -
 5
5 -
 6
6 -
 7
7 -
 8
8 -
 9
9 -
 10
10 -
 11
11 -
 12
12 -
 13
13 -
 14
14 -
 15
15 -
 16
16 -
 17
17 -
18
-
19
-
20
-
21
-
22
-
23
-
24
-
25
-
26
-
27
-
28
-
29
-
30
-
31
-
32
-
33
-
34
-
35
-
36
-
37
-
38
-
39
-
40
-
41
-
42
-
43
-
44
-
45
-
46
-
47
-
48
-
49
-
50
-
51
-
52
-
53
-
54
-
55
-
56
-
57
-
58
-
59
-
60
-
61
-
62
-
63
-
64
-
65
-
66
-
67
-
68
-
69
-
70
-
71
-
72
-
73
-
74
-
75
-
76
-
77
-
78
-
79
-
80
-
81
-
82
-
83
-
84
-
85
-
86
-
87
-
88
-
89
-
90
-
91
-
92
-
93
-
94
-
95
-
96
-
97
-
98
-
99
-
100
-
101
-
102
-
103
-
104
-
105
-
106
-
107
-
108
-
109
-
110
-
111
-
112
-
113
-
114
-
115
-
116
-
117
-
118
-
119
-
120
-
121
-
122
-
123
-
124
-
125
-
126
-
127
-
128
-
129
-
130
-
131
-
132
-
133
-
134
-
135
-
136
-
137
-
138
-
139
-
140
-
141
-
142
-
143
-
144
-
145
-
146
-
147
-
148
-
149
-
150
-
151
-
152
-
153
-
154
-
155
-
156
-
157
-
158
-
159
-
160
-
161
-
162
-
163
-
164
-
165
-
166
-
167
-
168
-
169
-
170
-
171
-
172
-
173
-
174
-
175
-
176
-
177
-
178
 |
 |

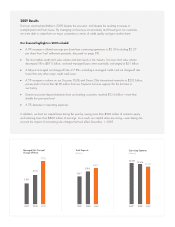
2009 Results
Discover remained profi table in 2009 despite the recession, and despite the resulting increases in
unemployment and loan losses. By managing our business conservatively and focusing on our customers,
we were able to outperform our major competitors in terms of credit quality and gain market share.
Our fi nancial highlights in 2009 included:
• A 9% increase in diluted earnings per share from continuing operations to $2.39 (including $2.27
per share from Visa® settlement proceeds, discussed on page 39).
• The most stable credit card sales volume and loan levels in the industry. Discover card sales volume
decreased 5% to $87.5 billion, and total managed loans were essentially unchanged at $51 billion.
• A full-year managed net charge-off rate of 7.8%—including a managed credit card net charge-off rate
lower than any other major credit card issuer.
• A 5% increase in volume on our Discover, PULSE and Diners Club International networks to $232 billion;
pre-tax profi t of more than $100 million from our Payments Services segment for the fi rst time in
our history.
• Direct-to-consumer deposit balances from our banking customers reached $12.6 billion—more than
double the prior-year level.
• A 7% decrease in operating expenses.
In addition, we built our capital base during the year by issuing more than $500 million of common equity
and retaining more than $800 million of earnings. As a result, our capital ratios are strong—even taking into
account the impact of accounting rule changes that took effect December 1, 2009.
Managed Net Principal
Charge-Off Rate
2007 2008 2009
3.83%
5.01%
7. 7 7 %
Total Deposits
[Billions]
2007 2008 2009
$24.7
$28.5
$32.1
Operating Expenses
[Millions]
2007 2008 2009
$2,478 $2,416 $2,251