Dillard's 2010 Annual Report Download - page 16
Download and view the complete annual report
Please find page 16 of the 2010 Dillard's annual report below. You can navigate through the pages in the report by either clicking on the pages listed below, or by using the keyword search tool below to find specific information within the annual report.-
 1
1 -
2
-
3
-
4
-
5
-
 6
6 -
 7
7 -
 8
8 -
 9
9 -
 10
10 -
 11
11 -
 12
12 -
 13
13 -
 14
14 -
 15
15 -
 16
16 -
 17
17 -
 18
18 -
 19
19 -
 20
20 -
 21
21 -
 22
22 -
 23
23 -
 24
24 -
 25
25 -
 26
26 -
27
-
28
-
29
-
30
-
31
-
32
-
33
-
34
-
35
-
36
-
37
-
38
-
39
-
40
-
41
-
42
-
43
-
44
-
45
-
46
-
47
-
48
-
49
-
50
-
51
-
52
-
53
-
54
-
55
-
56
-
57
-
58
-
59
-
60
-
61
-
62
-
63
-
64
-
65
-
66
-
67
-
68
-
69
-
70
-
71
-
72
-
73
-
74
-
75
-
76
-
77
-
78
-
79
 |
 |

22MAR201111125028
In February 2011, the Company announced that the Board of Directors authorized the repurchase
of up to $250 million of its Class A Common Stock. This authorization permits the Company to
repurchase its Class A Common Stock in the open market, pursuant to preset trading plans meeting
the requirements of Rule 10b5-1 under the Securities Exchange Act of 1934 or through privately
negotiated transactions. The plan has no expiration date.
Securities Authorized for Issuance under Equity Compensation Plans
The information concerning the Company’s equity compensation plans is incorporated by reference
here to Item 12 of this Annual Report on Form 10-K under the heading ‘‘Equity Compensation Plan
Information’’.
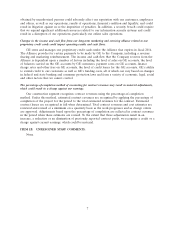
Company Performance
For each of the last five fiscal years, the graph below compares the cumulative total returns on the
Company’s Class A Common Stock, the Standard & Poor’s 500 Index and the Standard & Poor’s
Supercomposite Department Stores Index. The cumulative total return on the Company’s Class A
Common Stock assumes $100 invested in such stock on January 29, 2006 and assumes reinvestment of
dividends.
20102006 2007 2008 2009
Dollars
$200
$150
$100
$50
$0
Stock Performance Graph
Dillard S&P 500 S&P Supercomposite Dept. Strs
2006 2007 2008 2009 2010
Dillard’s, Inc. .................................. 135.81 80.22 17.25 66.94 163.94
S&P 500 ...................................... 114.77 112.66 68.21 90.88 110.26
S&P Supercomposite Department Stores ............... 145.06 93.86 42.70 72.09 83.89
12