Coach 2006 Annual Report Download - page 19
Download and view the complete annual report
Please find page 19 of the 2006 Coach annual report below. You can navigate through the pages in the report by either clicking on the pages listed below, or by using the keyword search tool below to find specific information within the annual report.
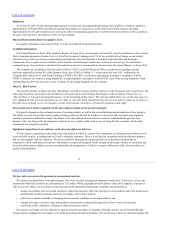
The decrease in administrative expenses was primarily due to a decrease in share-based compensation expense and other employee
staffing costs. However, fiscal 2006 expenses were reduced by $2.0 million due to the receipt of business interruption proceeds related to our
World Trade Center location. The Company did not receive any business interruption proceeds in fiscal 2007.
Net interest income was $41.3 million in fiscal 2007 compared to $32.6 million in fiscal 2006. This increase was primarily due to
higher returns on our investments as a result of higher interest rates and higher average cash and investment balances.
The effective tax rate was 38.5% in fiscal 2007 compared to 37.9% in fiscal 2006. This increase is primarily attributable to incremental
income being taxed at higher rates.
Income from continuing operations was $636.5 million in fiscal 2007 compared to $463.8 million in fiscal 2006. This 37.2% increase
is attributable to increased net sales as well as significant operating margin improvement, as discussed above.
Income from discontinued operations was $27.1 million in fiscal 2007 compared to $30.4 million in fiscal 2006. In fiscal 2007, net
sales related to the corporate accounts business were $66.5 million compared to $76.4 million in fiscal 2006. The decrease in net sales and
income is attributable to the exiting of the corporate accounts business during the third quarter of fiscal 2007.
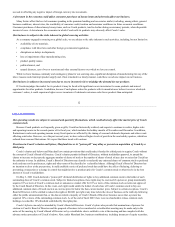
The following table summarizes results of operations for fiscal 2006 compared to fiscal 2005:
(dollars in millions, except per share data)
Net sales $ 2,035.1 100.0% $ 1,651.7 100.0% $ 383.4 23.2%
Gross profit 1,581.6 77.7 1,267.6 76.7 314.0 24.8
Selling, general and
administrative expenses
866.9 42.6 731.9 44.3 135.0 18.4
Operating income 714.7 35.1 535.7 32.4 179.0 33.4
Interest income, net 32.6 1.6 15.8 1.0 16.9 107.0
Provision for income taxes 283.5 13.9 201.1 12.2 82.4 40.9
Minority interest — 0.0 13.6 0.8 (13.6) (100.0)
Income from continuing operations 463.8 22.8 336.6 20.4 127.2 37.8
Income from discontinued operations, net
of taxes
30.4 1.5 22.0 1.3 8.5 38.6
Net income 494.3 24.3 358.6 21.7 135.7 37.8
Net income per share:
Basic:
Continuing operations $ 1.22 $ 0.89 $ 0.33 37.4%
Discontinued
operations
0.08 0.06 0.02 38.2
Net income 1.30 0.95 0.35 37.5
Diluted:
Continuing operations $ 1.19 $ 0.86 $ 0.33 38.4%
Discontinued
operations
0.08 0.06 0.02 39.2
Net income 1.27 0.92 0.35 38.4
24
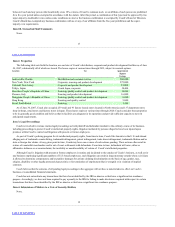
The following table presents net sales by operating segment for fiscal 2006 compared to fiscal 2005:
(dollars in millions)
Direct-to-Consumer $ 1,610.7 $ 1,307.4 23.2% 79.1% 79.2%
Indirect 424.4 344.3 23.3 20.9 20.8


